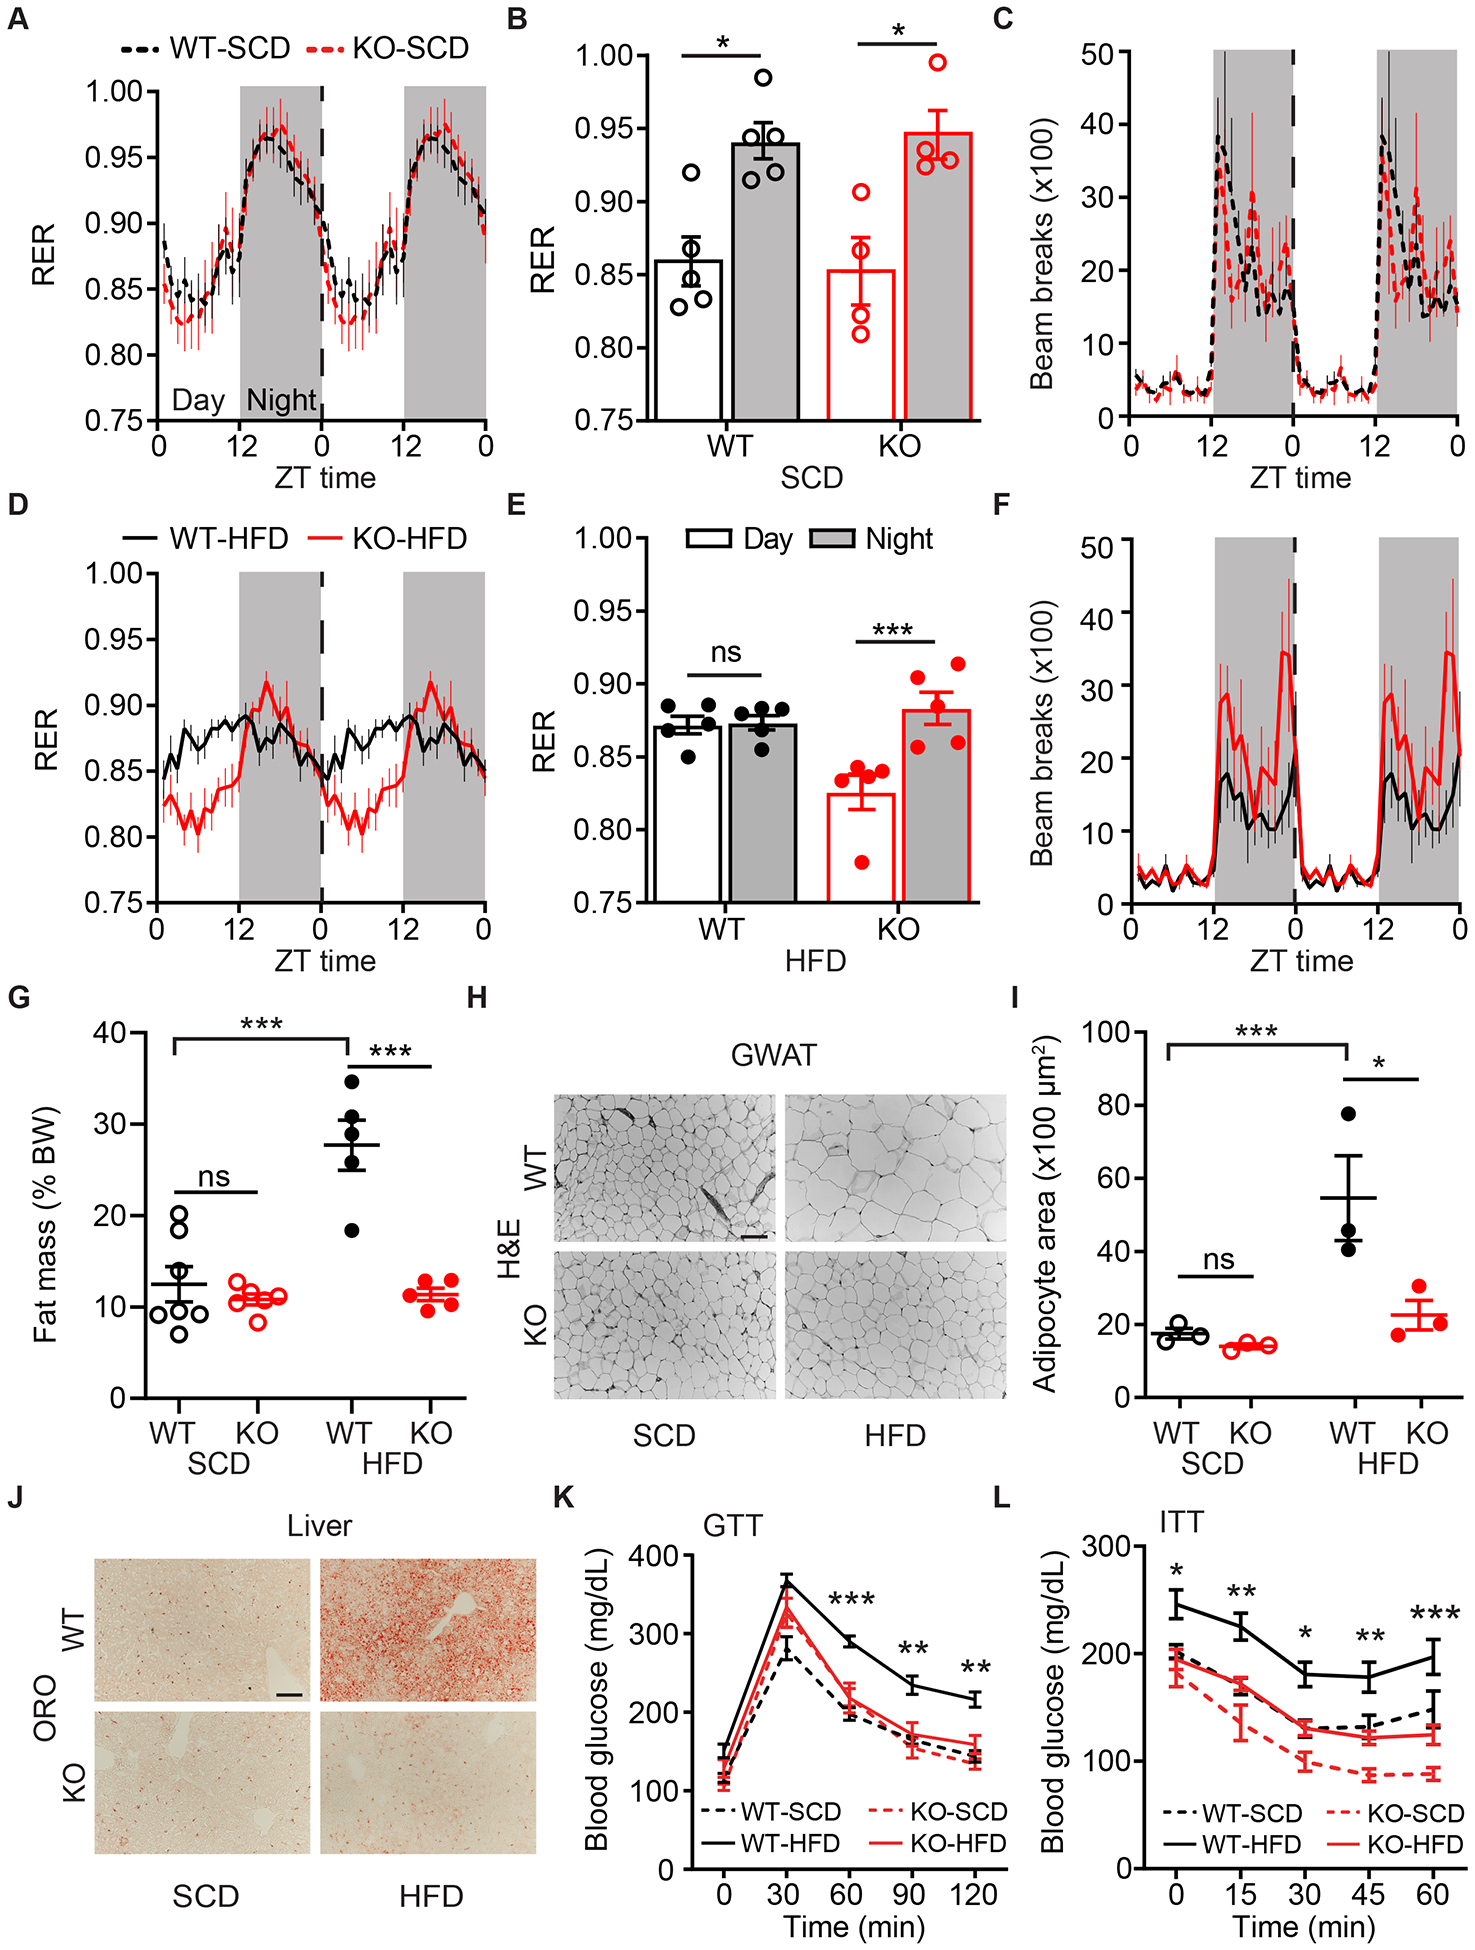
Figure 2. Drd1-KO Mice are Resistant to HFD-Induced Metabolic Disease.

(A) RER for WT-SCD and KO-SCD mice. Repeated-measures two-way ANOVA, n=4–5/group. Time is represented as Zeitgeber time (ZT), where ZT0 indicates onset of Day and ZT12 indicates onset of Night (shaded grey). Data are plotted in 1-hour intervals. Vertical dotted line indicates the point at which twenty-four-hour data are double-plotted for clarity. Same representation applies to panels (C), (D) and (F).
(B) Average RER during the Day or Night from panel (A). Repeated-measures two-way ANOVA with Bonferroni post-hoc comparison, n=4–5/group; Ftime(1,7)=57.5, p<0.001.
(C) Double-plotted ambulatory infrared beam-break activity for WT-SCD and KO-SCD mice. Repeated-measures two-way ANOVA with Bonferroni post-hoc comparison, n=4–5/group.
(D) Double-plotted RER for WT-HFD and KO-HFD mice. Repeated-measures two-way ANOVA with Bonferroni post-hoc comparison, n=5/group.
(E) Average RER during the Day or Night from panel (D). Repeated-measures two-way ANOVA with Bonferroni post-hoc comparison, n=5/group; Ftime(1,8)=15.8, p=0.004.
(F) Double-plotted ambulatory infrared beam-break activity for WT-HFD and KO-HFD mice. Repeated-measures two-way ANOVA with Bonferroni post-hoc comparison, n=5/group; Fgenotype(1,8)=5.4, p=0.05.
(G) Fat mass as percent BW for WT and KO mice on SCD or HFD. Two-way ANOVA with Bonferroni post-hoc comparison, n=5–7/group; Fdiet(1,19)=20.3, p<0.001; Fgenotype(1,19)=26.5, p<0.001.
(H) Representative GWAT Hematoxylin and Eosin (H&E) stain for groups in (G). Scale bar=100μm.
(I) Quantification of GWAT adipocyte area. Two-way ANOVA with Bonferroni post-hoc comparison, n=3/group; Fdiet(1,8)=13.5, p=0.006; Fgenotype(1,8)=8.2, p=0.02.
(J) Representative liver Oil-red-O (ORO) histology for groups in (G), where hepatic lipid content stains as red. Scale bar=100μm.
(K) Blood glucose levels during glucose tolerance test (GTT). Repeated-measures three-way ANOVA with Bonferroni post-hoc comparison, n=8–12/group; Fgenotype(1,35)=5.5, p=0.03; Fdiet(1,35)=21.9, p<0.001. And (L) insulin tolerance test (ITT). Repeated-measures three-way ANOVA with Bonferroni post-hoc comparison; n=9–12/group; Fgenotype(1,36)=26.4, p<0.001; Fdiet(1,36)=18.4, p<0.001. Statistical significance between WT-HFD and KO-HFD is depicted.
Data are represented as mean±SEM. *p<0.05,**p<0.01,***p<0.001.
