
Figure 3. HFD-Induced Peripheral Abnormalities are Only Partially Protected in Drd1-KO Mice.
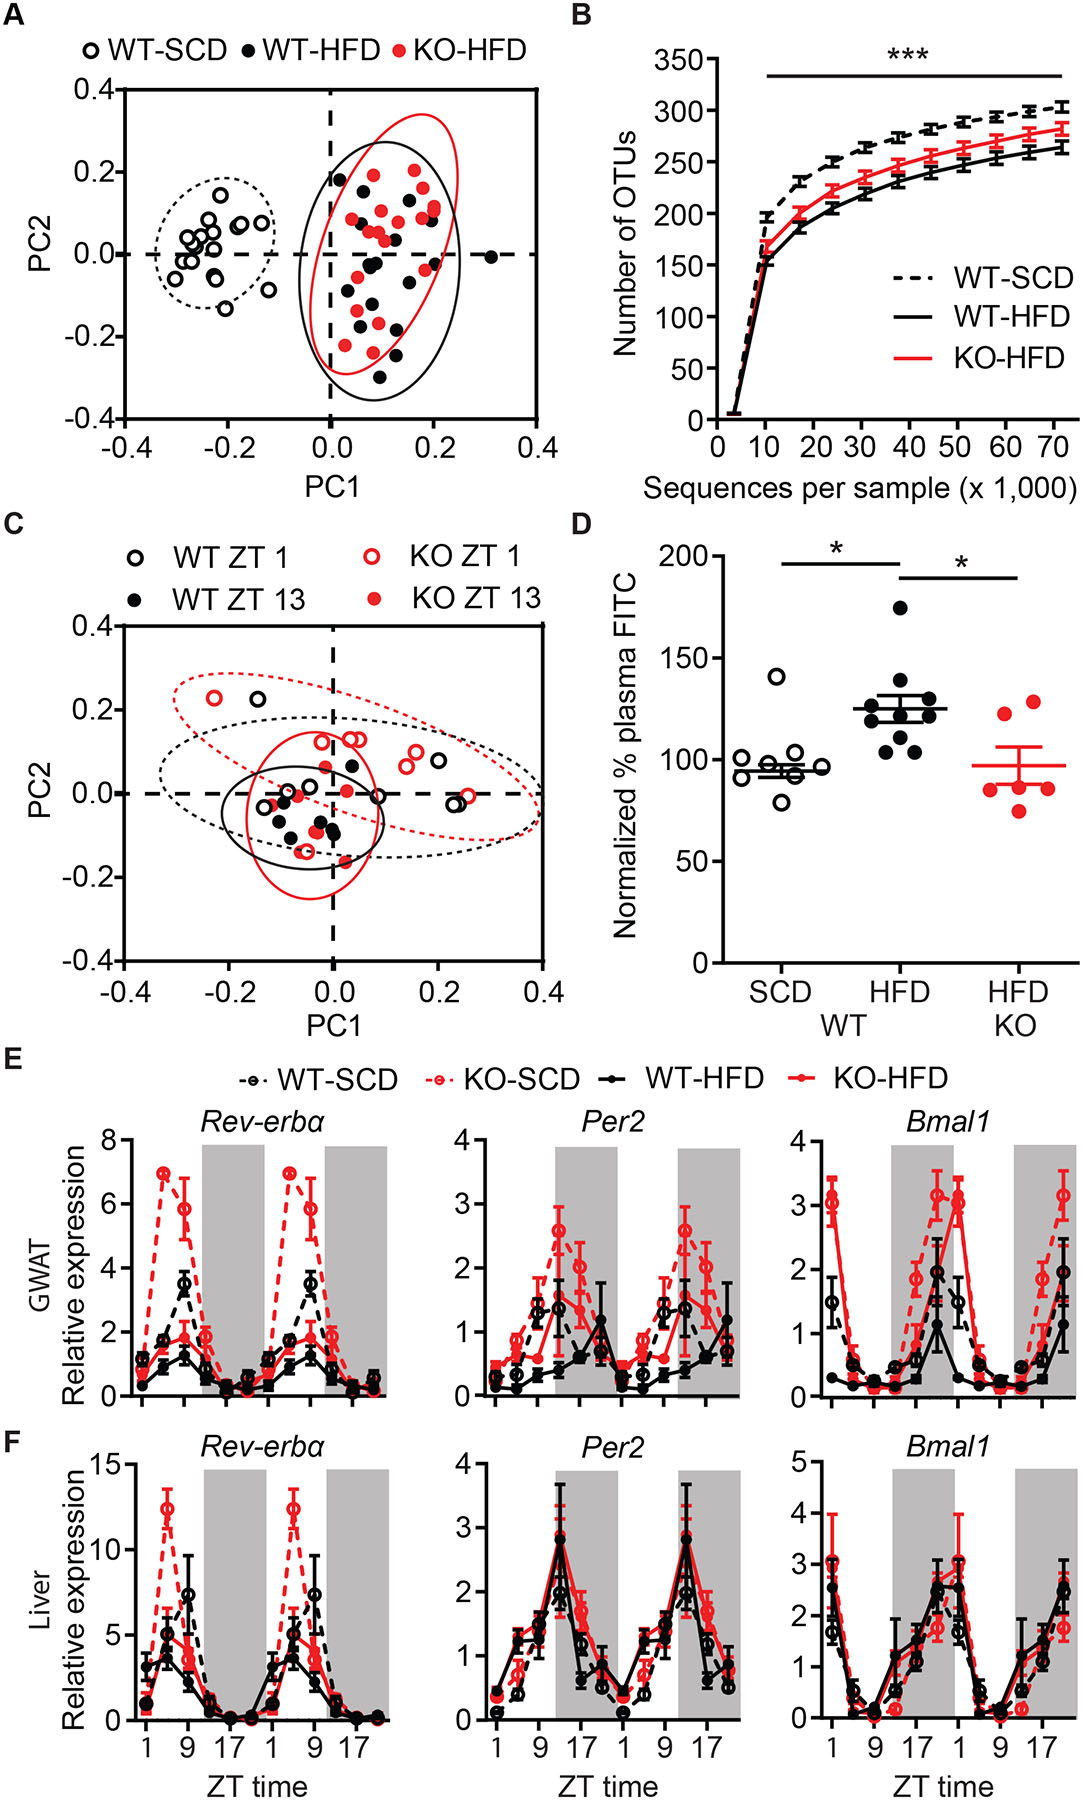
(A) Weighted UniFrac principal component analysis (PCA) of microbiome composition comparing WT-SCD, WT-HFD, and KO-HFD mice. 95% normal confidence ellipses are illustrated.
(B) Alpha diversity of fecal microbiome operational taxonomic units (OTUs). Repeated measures two-way ANOVA with Bonferroni post-hoc comparison, n=18/group; Ftreatment(2,51)=15.1, p<0.001. Statistical significance between WT-SCD and WT-HFD is depicted.
(C) Weighted UniFrac PCA analysis of fecal samples collected from the same mouse at ZT1 and ZT13 for WT-HFD and KO-HFD mice. 95% normal confidence ellipses are illustrated.
(D) Plasma fluorescence normalized to WT-SCD levels following oral gavage of FITC-Dextran. One-way ANOVA with Bonferroni post-hoc comparison, n=6–10/group; F(2,21)=4.9, p=0.02.
(E–F) Double-plotted RNA expression level of circadian genes Rev-erbα, Per2 and Bmal1 in GWAT (E) and liver (F). Three-way ANOVA with Bonferroni post-hoc comparison, n=3/time point/group (See also Table S2). Time is represented in ZT.
Data are represented as mean±SEM. *p<0.05,***p<0.001.