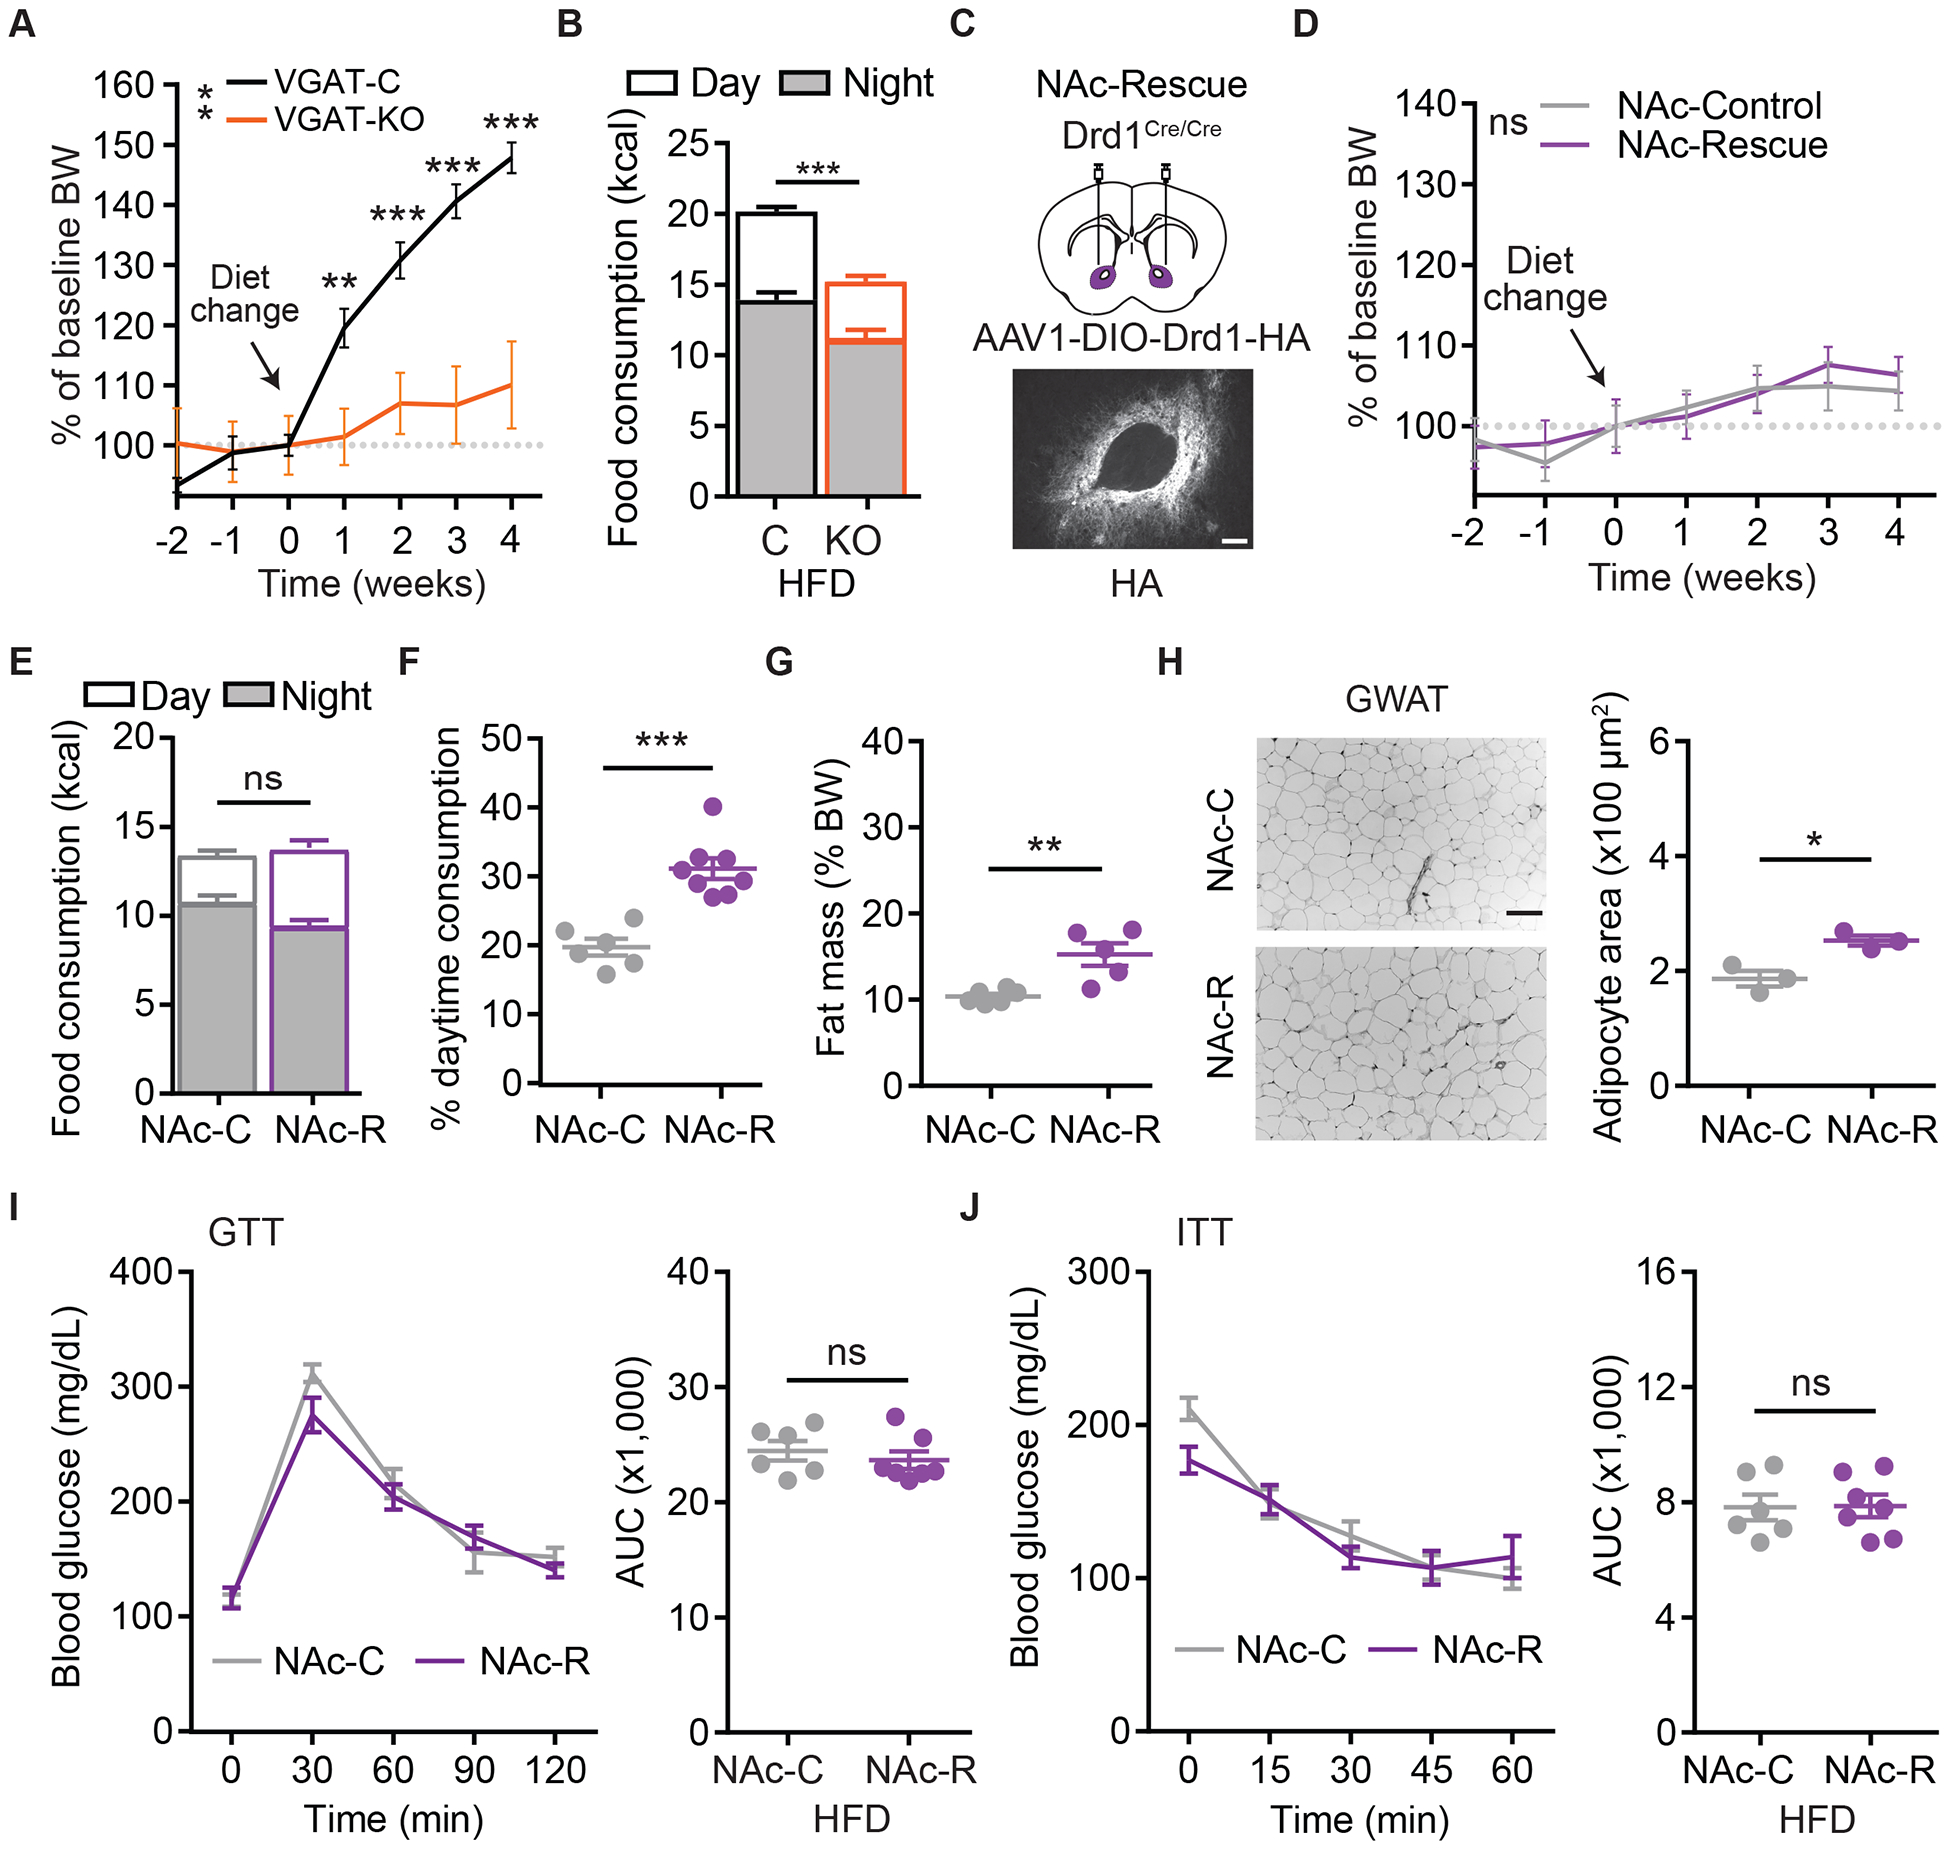
Figure 4. Selective Re-expression of Drd1 Within the NAc of Drd1-KO Mice Partially Rescues HFD-Induced Phenotypes Excluding Obesity.

(A) Percent BW change relative to week 0 for VGAT+/+;Drd1fl/fl (VGAT-C), and VGATCre/+;Drd1fl/fl (VGAT-KO) mice following access to high fat/low sugar diet. Repeated-measures two-way ANOVA with Bonferroni post-hoc comparison, n=7–16/group; Fgenotype(1,21)=10.4, p=0.004.
(B) Daily total calorie consumption of VGAT-C and VGAT-KO mice on HFD. Day (white) and Night (grey) consumption are segregated for clarity. Student’s two-tailed t-test, n=7–16/group.
(C) Top: Schematic diagram illustrating NAc bilateral injection of AAV1-DIO-Drd1-HA or AAV1-ChR2-YFP in KO (Drd1cre/cre) mice. Bottom: Anti-HA immunohistochemical labeling within the NAc. Scale bar=100um.
(D) Percent BW change relative to week 0 for NAc-control (NAc-C) and NAc-Rescue (NAc-R) mice on HFD. Repeated-measures two-way ANOVA with Bonferroni post-hoc comparison, n=6–8/group.
(E) Daily total calorie consumption of NAc-control (NAc-C) and NAc-Rescue (NAc-R) mice on HFD. Student’s two-tailed t-test, n=6–8/group.
(F) Portion of Day consumption on HFD. Student’s two-tailed t-test, n=6–8/group.
(G) Fat mass as percent BW on HFD. Student’s two-tailed t-test, n=5–6/group.
(H) Representative GWAT histology with H&E stain (left) and quantification of GWAT adipocyte area (right). Scale bar=100μm. Student’s two-tailed t-test, n=3/group.
(I) and (J) Blood glucose levels over time (left; repeated-measures two-way ANOVA with Bonferroni post-hoc comparison, n=6–7/group) and area under the curve (AUC) quantification (right; Student’s two-tailed t-test, n=6–7/group) during GTT (I) or ITT (J).
Data are represented as mean±SEM. *p<0.05,**p<0.01,***p<0.001, ns=not significant.
