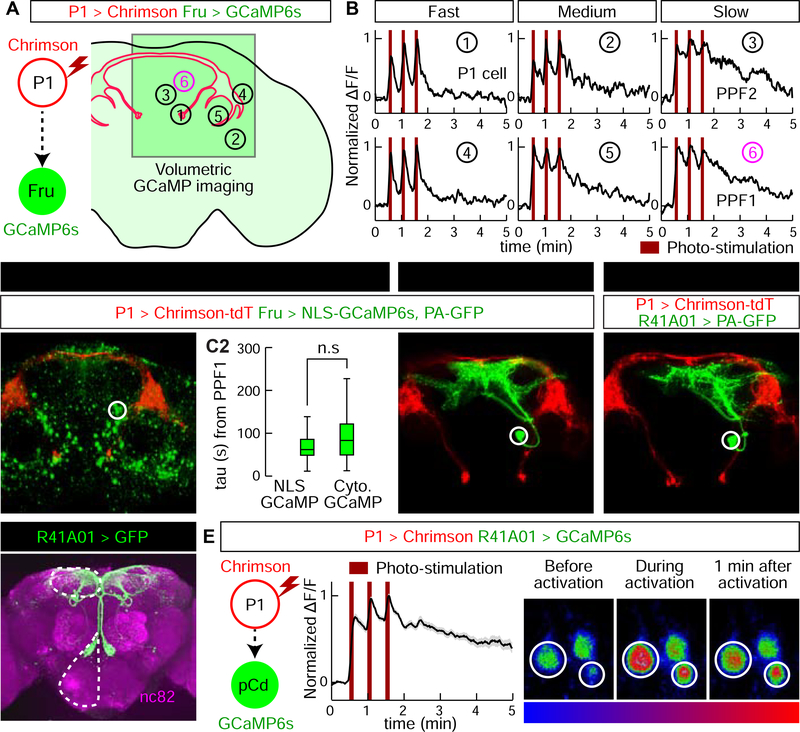
Figure 1. Identification of P1 follower cells with long-lasting responses.
(A) Experimental schematic. Green square indicates imaging field containing different putative P1 follower cells (numbered circles). (B) Representative GCaMP6s traces (normalized ΔF/F ); numbers correspond to cells in (A). PPF1 cells (➅) are pCd neurons. 655 nm light (10 Hz, 10 ms pulse-width, 25 s inter-stimulation interval) was delivered for Chrimson stimulation (dark red bars). (C1–4) Identification of GAL4 driver labeling PPF1 (pCd) neurons (See Figure S2A for details). (C1) LexAop-NLS-GCaMP expressed in Fru-LexA neurons; white circle, PPF1 somata. (C2) Comparison between NLS GCaMP6s and Cytoplasmic GCaMP6s. Decay constants (tau) were calculated by curve fitting (See Figure S1I and Methods for details). n=32 trials, 11 cells from 7 flies (NLS GCaMP), 77 cells from 12 flies (Cytoplasmic GCaMP). Statistical significance in this and in all other figures (unless otherwise indicated) was calculated using a Mann-Whitney U-test. Boxplots throughout show the median (center line), 25th and 75th percentiles (box), and 1.5 times the interquartile range (whiskers). Outliers were defined as data points falling outside 1.5x the interquartile range of the data, and were excluded from plots for clarity, but not from statistical analyses. (C3) PPF1 projections revealed by Fru-LexA>PA-GFP activation (Datta et al., 2008). (C4) PPF1 neurons labeled by R41A01-LexA>PA-GFP. Non-PPF1 PA-GFP and NLS-GCaMP basal fluorescence have been masked for clarity. All images in C1, C2, and C4 are maximum intensity z-projections of 2-pm optical sections acquired by 2-P imaging. (D) Central brain R41A01 Gal4 neurons revealed by UAS-myr::GFP reporter. Superior medial protocerebrum (SMP) and sub-esophageal zone (SEZ) are indicated by dashed outlines. (E) LexAop-GCaMP6s response of pCd neurons labeled by R41A01-LexA following P1-Gal4/UAS-Chrimson stimulation (see Supp. Table 1 for genotypes). Left, schematic; middle, normalized ΔF/F trace (n=23 trials, 15 cells from 10 flies; mean±sem); right, fluorescent images taken before, during, and 1 minute after P1 activation (averaged over 5 frames). White circles indicate two responding cells.

