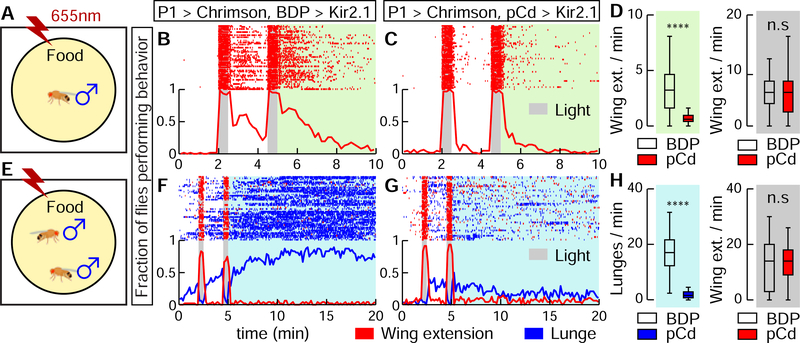
Figure 2. Activity of pCd neurons is required for P1-induced persistent behaviors.
(A) Schematic (approximately to scale). Chrimson activation at 655 nm (Inagaki et al., 2014) was performed in solitary males on food. (B, C) Behavior of flies during (gray shading) and after (green shading) P1a (Hoopfer et al., 2015; Anderson, 2016) neuronal activation, either without (B; BDP is enhancerless LexA control driver), or with (C; pCd-LexA) Kir2.1-mediated (Baines et al., 2001) inhibition of pCd neurons. Grey bars, 30 s photostimulations (40 Hz, 10 ms pulse-width) at 2 min intervals. Upper: Wing extension raster plot (red ticks). Lower: fraction of flies performing wing extensions (red line) in 10 s time bins. n=62 (B), 63 (C). (D) Wing extension frequency per fly after (green shading) or during (grey shading) photostimulation. **** P < 0.0001. (E) As in (A), but using male pairs. (F, G) Plot properties as in (B, C). Grey bars, 30 s photostimulation periods (2 Hz, 10 ms pulse-width) at 2 min intervals. Upper: raster plot showing wing extensions (red ticks) and lunges (blue ticks). Lower: fraction of flies performing wing extensions (red line) or lunges (blue line) in 20 s time bins. n=48 for each genotypes. (H) Lunge frequency after photostimulation (light blue shading, left), and wing extension frequency during photostimulation (grey shading, right). Lunging during, and wing extension after photostimulation were ≤ 1 event/min and are omitted for clarity. Statistics as in (D).

