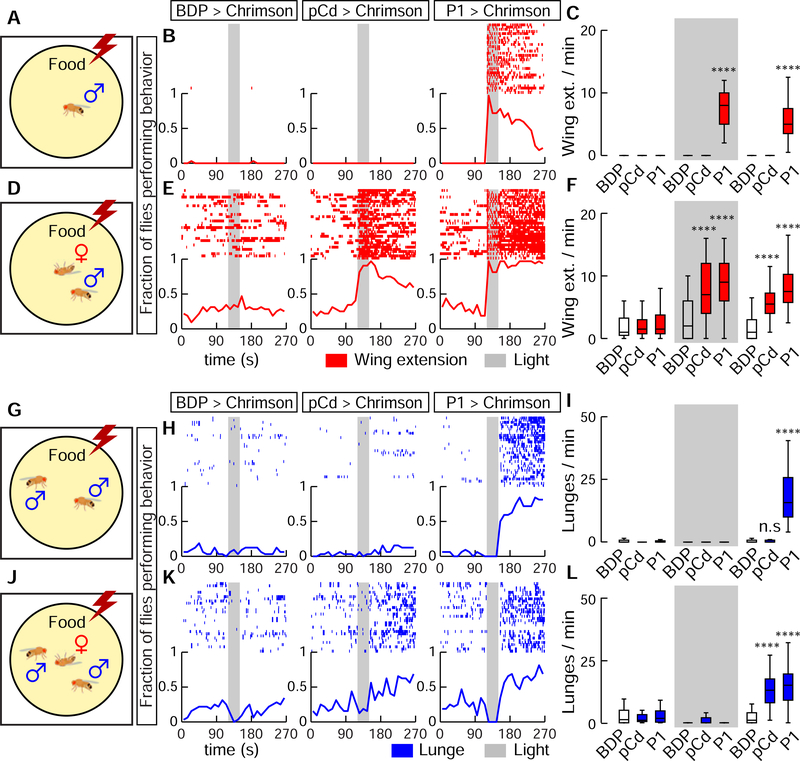
Figure 3. Activation of pCd neurons amplifies and extends male social behaviors induced by female cues.
(A, D, G, and H), experimental schematics illustrating optogenetic activation of pCd neurons in solitary males (A-F) or pairs of group-housed males (G-L), tested without (A-C, G-I) or with (D-F, J-L) a dead female. Raster plots and fraction of flies performing behaviors (red and blue lines, 10 s time bins) are shown in (B, E, H, and K). Plot properties same as in Figure 2. Grey bars, 30 s Chrimson activation at 655 nm (10 Hz, 10 ms pulse-width). Quantification and statistical tests shown in (C, F, I, and L). n=32 flies each. Statistical test used was a Kruskal-Wallis test. **** Dunn’s corrected P < 0.0001 for between-genotype comparisons. Courtship data are omitted in (H, K) for clarity.

