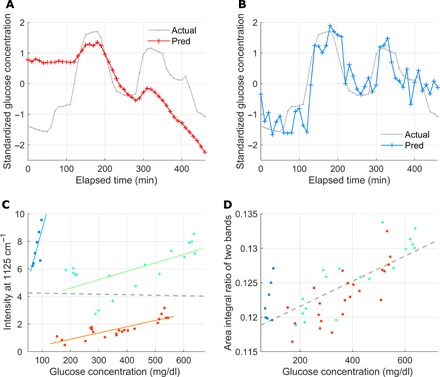
Fig. 3. Prediction in intersubject recordings.

A model is trained with recordings of trials 1 and 2 and is used for prediction in trial 3 recordings. (A) Prediction using PLS regression with full-range background-subtracted spectra (R = 0.17). (B) Prediction using MLR with four band area features. Three are extracted from the glucose-specific bands, and the last one is from a skin component peak (R = 0.82). (C) Linearity between the Raman peak intensity and glucose concentration for trial 3 is observed only in each of the three time-continuous parts of the recordings (separated by color, R = 0.74 on average), but not for the entire recording (R = −0.02) with the spectra subtraction method. (D) The linearity improves with the same recordings as in (C) when the ratio of the two band area features is used (R = 0.73).
