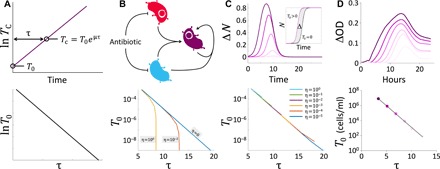
Fig. 2. A time to threshold method for conjugation quantification.

(A) The principle of time to threshold quantification. Consider the exponential growth of the transconjugant from an initial density T0 (top panel). The time (τ) required for the population to reach a set threshold (TC) is uniquely determined by T0 and the specific growth rate (μ). This defines a log-linear relationship between T0 and τ: lnT0 = ln TC − μτ (bottom panel). (B) Quantification of T0 is complicated by the presence of donor and recipient cells. Top panel: Although strong antibiotic selection is applied against donor and recipient cells during transconjugant outgrowth, death is not instantaneous (i.e., conjugation may still occur). Bottom panel: Modeling reveals conjugation of variable efficiency (η) during outgrowth causes a deviation from the log-linear relationship. This effect is amplified with smaller T0, where transconjugants produced from outgrowth conjugation—not outgrowth alone—may comprise a sizeable proportion of the total transconjugant population. (C) Correcting for outgrowth conjugation. Top panel: The growth contribution from the transconjugant alone can be approximated by the difference (ΔN) between the growth curves originating from the conjugation mixture (T0 > 0) and conjugation control (T0 = 0). Darker curves represent higher T0. Bottom panel: Using ΔN, the log-linear relationship between T0 and τ is maintained even in the presence of conjugation during outgrowth. (D) Applying the time to threshold method to experimental data. T0, spanning six orders of magnitude, maintains a strong correlation (R2 > 0.99) with τ from a ΔOD threshold. Darker curves represent higher T0.
