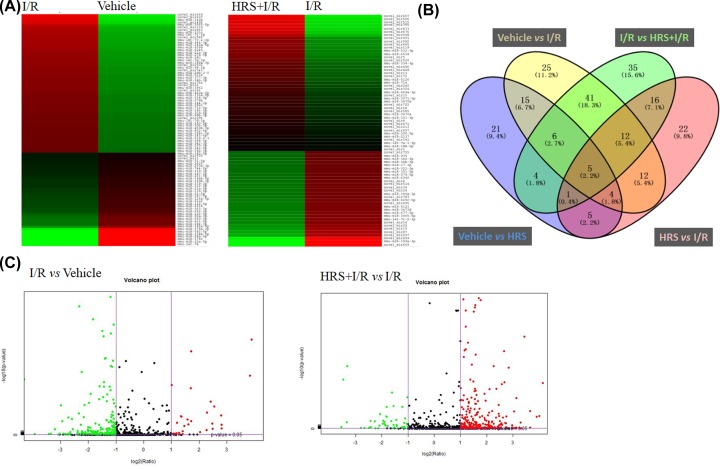
Figure 2. MiRNA sequencing analysis of intestinal mucosa.
Heat map (A) and volcano plots (C) present expression profiles of significantly altered miRNAs with fold change ≥2.0 (P < 0.05; false discovery rate <0.05) in response to I/R and HRS in the intestine. Green indicates down-regulation and red indicates up-regulation. Color brightness depicts the relative miRNAs expression level as brighter color represents higher expression. (B) Venn diagram indicates number of miRNAs counts in each group or shared between groups (overlapped area). HRS, hydrogen-rich saline; I/R, ischemia/reperfusion.

