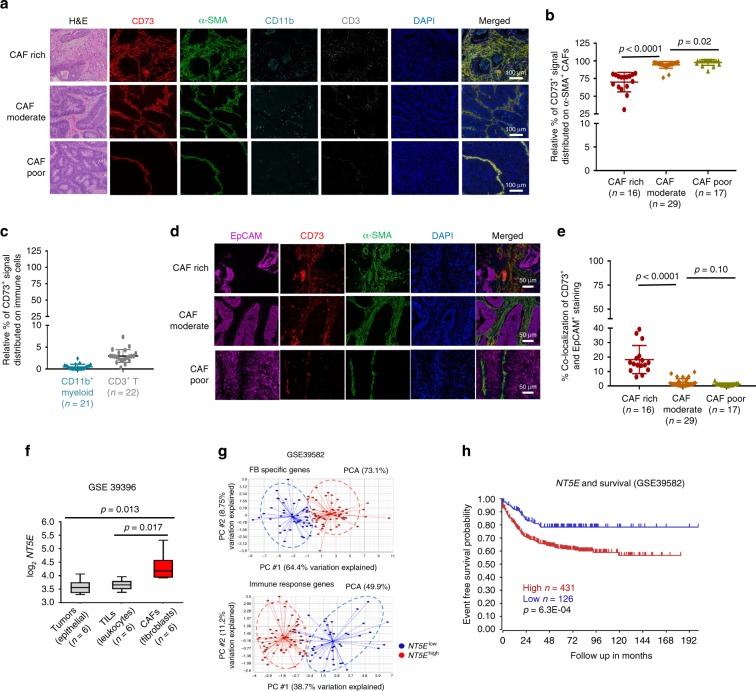
Fig. 1. Elevated CD73 levels in human CRCs are associated with CD73hi-CAF abundancy and poor clinical outcomes.
a Histological H&E examination (left) and multiplex immunohistochemistry (IHC) staining of CD73 (red), a-smooth muscle actin (a-SMA, green), CD11b (cyan), and CD3 (gray) were performed with de-identified FFPE CRC-specimen. Nuclei were counterstained with DAPI (blue). Representative images illustrate the level of CD73 expression and its bio-distribution on CAFs (α-SMA+), CD11b+ myeloid, and CD3+ T cells in CAF-rich, moderate, and poor specimens. Scale bars, 100 μm. b, c Randomly selected and evenly distributed areas (~5 × 105 mm2) from each multiplex IHC-stained CRC specimen were analyzed for the percentage of CD73+ signal that distributed on α-SMA+ b, CD11b+, and CD3+ cells c among the total CD73+ region in each area, which was set as 100%, was calculated and plotted. d Multiplex IHC staining was performed to determine tumor (EpCAM, magenta), CD73 + (red) cells, and CAFs (α-SMA, green) distribution and their potential co-localization. Scale bars, 50 μm. e The percentage of CD73+ signal on EpCAM+ tumors against total CD73+ region was presented. f CD73 (NT5E) gene expression in paired purified CRC-CAFs (red box), TILs, and tumors from published dataset (GSE39396) was compared. g Principle component analysis was performed with a published CRC cohort dataset (GSE39582) of 557 CRC specimens. The NT5Ehigh (red) and NT5Elow (blue) specimens were first defined by their CD73 expression in the top 20% and bottom 20% level, respectively, and clustered against a group of 18 fibroblast-specific (FB) genes that shows a positive correlation and against a group of 15 pre-defined group immune effector function associated genes as Immune response genes that reveals negative association. h The Kaplan–Meier survival curve demonstrates clinical correlation of NT5Ehigh (red) and NT5Elow (blue) expression in CRC patients (GSE 39582) with event-free survival. Data depict mean ± SEM. Unpaired Student’s t-test for b, c, e and paired Student’s t-test for f. Source data are provided in the Source Data file.

