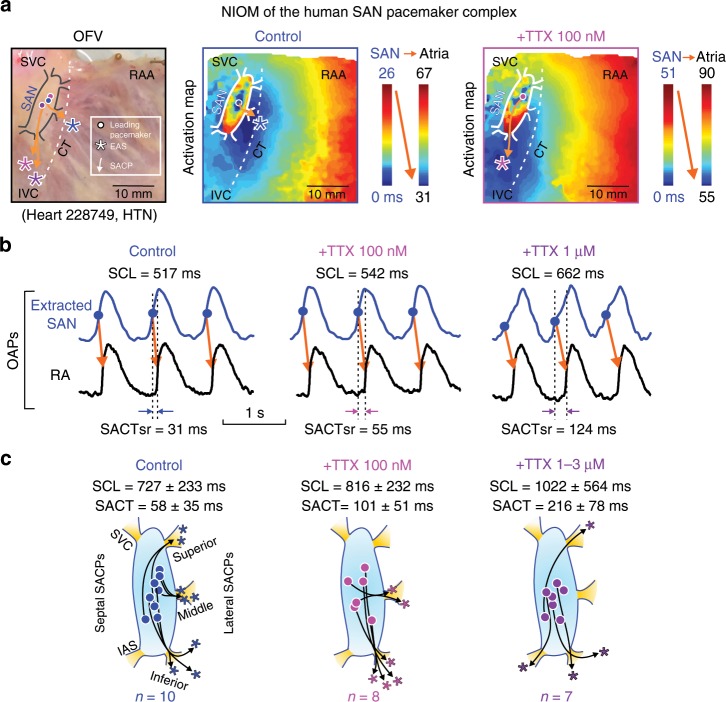
Fig. 1. High-resolution near-infrared optical mapping (NIOM) reveals effect of nNav and cNav blockade on human SAN intramural activation.
a Left: human SAN preparation and optical mapping field of view (OFV). Activation maps of Heart 228749 at control (middle) and during 100 nM TTX perfusion (right). Dot indicates the leading pacemaker inside the sinoatrial node (SAN); asterisk indicates the earliest atrial activation site (EAS); arrow indicates the sinoatrial conduction pathway (SACP). b TTX effects on sinus cycle length (SCL) and sinoatrial conduction time at sinus rhythm (SACTsr). c Locations of SAN leading pacemaker (dots), earliest atrial activation site, and sinoatrial conduction pathways at control (left, n = 10), during perfusion of 100 nM (middle, n = 8), and 1–3 µM TTX (right, n = 7). Data presented as mean ± SD. CT crista terminalis, n/cNav neuronal/cardiac sodium channels, OAP optical action potential, RA (A) right atrial (appendage), S/IVC superior/inferior vena cava, TTX tetrodotoxin. Source data are provided as a Source Data file.

