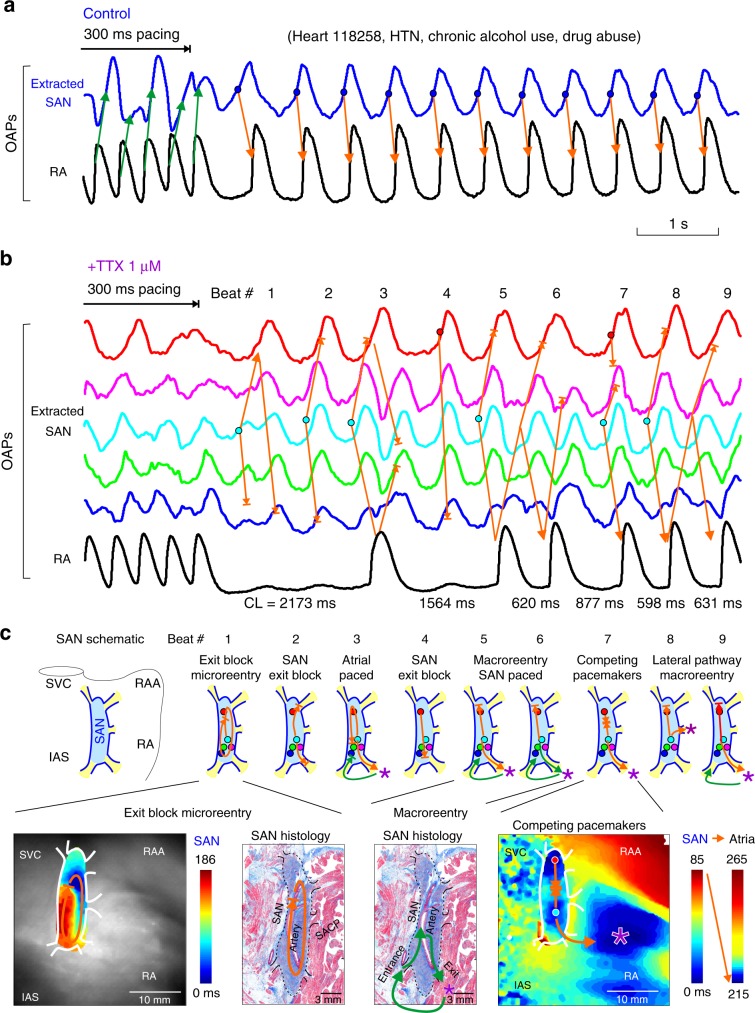
Fig. 4. Pacing-induced SAN conduction failure and reentrant arrhythmias during nNav and cNav blockade.
a Optical action potentials (OAPs) show regular sinus rhythm and sinoatrial conduciton after 3.3 Hz atrial pacing at control. b OAPs show irregular sinus rhythm, atrial pause, and arrhythmia after 3.3 Hz atrial pacing during 1 µM TTX perfusion. c SAN activation and conduction pattern revealed by high-resolution optical mapping could explain the mechanism underlying the post-pacing reentrant arrhythmia during cardiac Nav blockade by 1 µM TTX. Top, schematic of the SAN pacemaker complex representing activation pattern for 9 post-pacing beats. Bottom, SAN activation maps and corresponding histology sections show locations of micro-reentry and macro-reentrant pathways within the SAN complex stucture. Colored dots indicate positions of sinoatrial (SAN) OAPs presented in b. Orange arrows show the conduction direction within the SAN and green arrows indicate conduction outside the SAN; asterisk indicates the earliest atrial activation site. IAS interatrial septum, RA(A) right atrial (appendage), S/IVC superior/inferior vena cava, SAN sinoatrial node, TTX tetrodotoxin.

