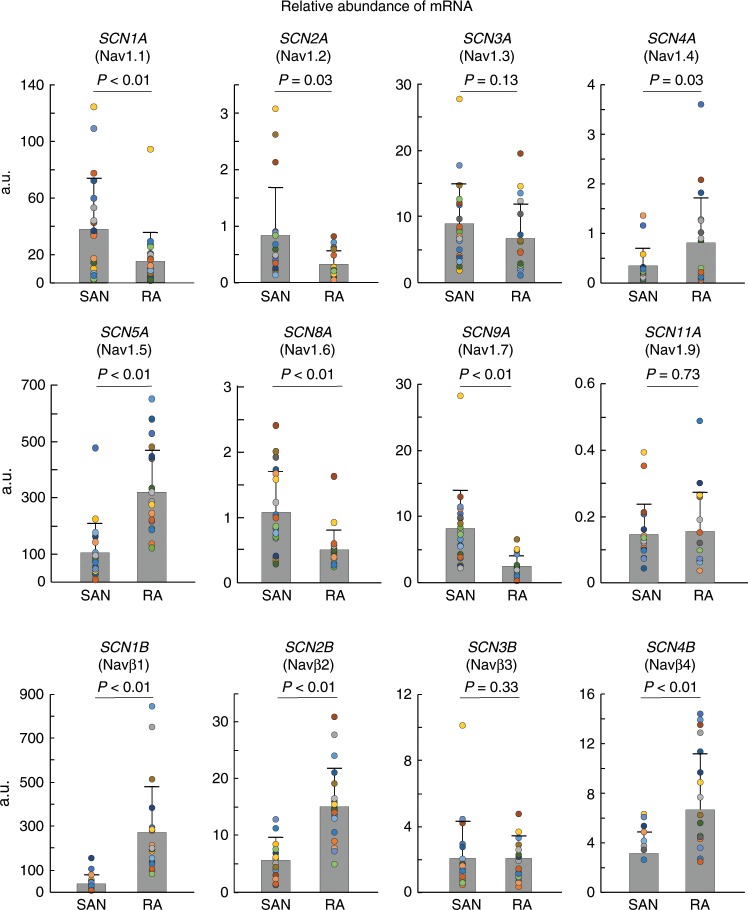
Fig. 5. Distribution of cNav and nNav subunit mRNA in the human SAN and RA.
Summary data of qPCR analysis of different Nav isoform mRNA levels in the human sinoatrial node (SAN) and right atrial (RA) tissue; colored circles indicate individual data points for each human heart. All mRNA values were normalized to the ribosomal 18s gene. Nav voltage-gated sodium channels. Data were represented in mean ± SD; n = 20 for each group; normality was tested with Shapiro–Wilk test; two-sided t-test was used for parametric data and Wilcoxon’s test was used for non-parametric data. Source data are provided as a Source Data file.

