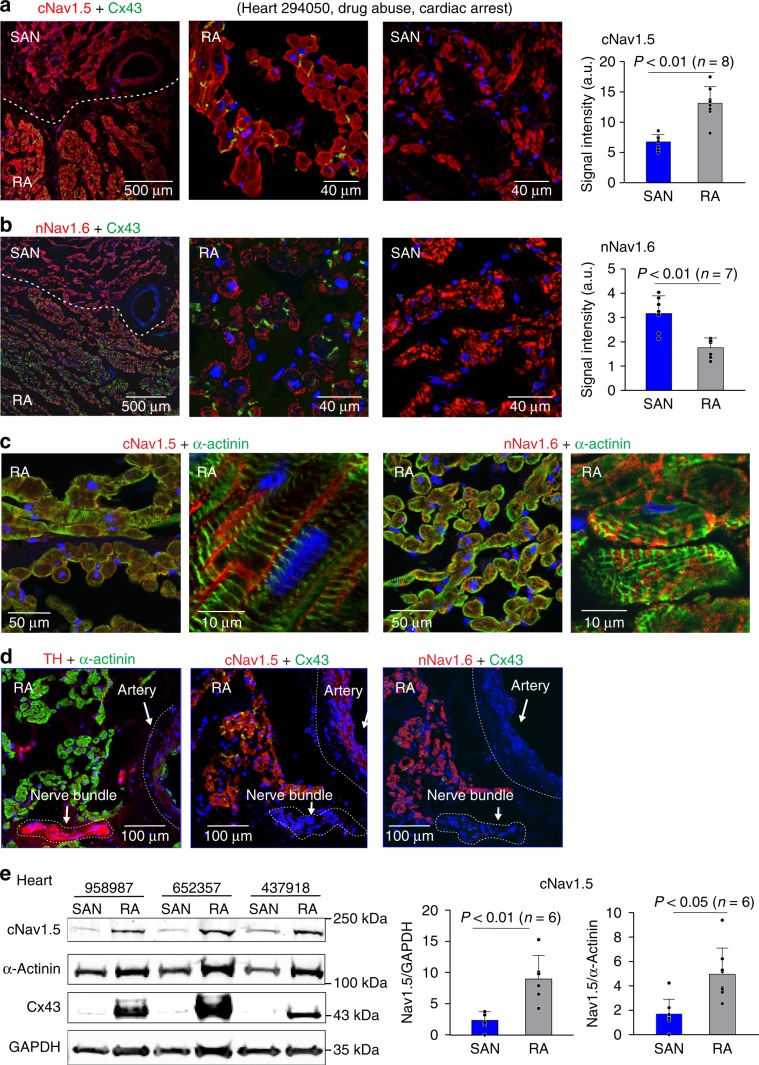
Fig. 6. Protein distribution of cNav1.5 and nNav1.6 in the human SAN and RA.
a Left to right: immunofluorescence image showing double staining of cNav1.5 (red) and Cx43 (green) in human heart 294050 cryosection with sinoatrial node (SAN) and right atrial (RA) regions (n = 8) separated by white dotted line; magnification of image to show the distribution of cNav1.5 in the RA vs. the SAN; bar graph showing fluorescence signal intensity in the human SAN vs. RA. b Left to right: immunofluorescence image showing double staining of nNav1.6 (red) and Cx43 (green) in human heart cryosection with SAN and RA regions (n = 7) separated by white dotted line; magnification of image to show the distribution of Nav1.6 in the RA vs. the SAN; bar graph showing fluorescence signal intensity in the human SAN vs. RA. c Left to right: cNav1.5 (red) and α-actinin (green; staining cardiomyocytes) dual staining; nNav1.6 (red) and α-actinin (green) dual staining confirm the cardiomyocyte-specific localization of cNav1.5 and nNav1.6. d Serial sections staining cNav1.5, nNav1.6, Cx43, and a nerve bundle labeled by anti-tyrosine hydroxylase (TH: staining sympathetic nerves) show that nNav1.6 and cNav1.5 are predominantly found in the myocytes relative to nerve bundles. All presented images a–d were collected from human heart 294050. e Left: representative immunoblotting bands for cNav1.5, α-actinin (marker of cardiomyocytes), and Cx43. Right: summary data of immunoblotting results of cNav1.5 protein distribution in the human SAN (n = 6) and RA (n = 6), compared with GAPDH (middle) and α-actinin (right), respectively. Cx43 connexin-43, GAPDH glyceraldehyde 3-phosphate dehydrogenase. Data were represented in mean ± SD. For immunostaining, analysis was done using lme4 and emmeans packages in R 3.4.4. Predictors included Heart (treated as random effect) and Condition (fixed effect). Pairwise tests between Condition levels were adjusted using Tukey’s method. Western blotting data analysis was done using two-sided t-test. Source data and uncropped versions of the western blot are provided as a Source Data file.

