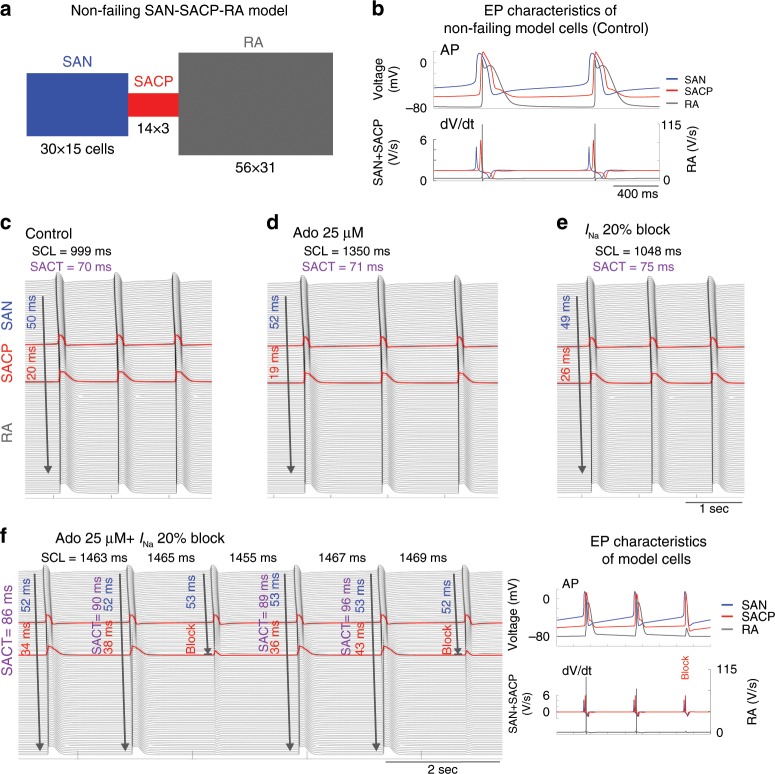
Fig. 8. Human non-failing SAN computer simulations define Nav’s protective role in SAN pacemaking and conduction.
a Geometry of 2D computer model. b Action potentials (AP) and their derivatives (dV/dt) show different electrophysiological (EP) characteristics of SAN, SACP, and RA cells in the current model. Propagation of APs along the middle axis of the 2D SAN-atrium are displayed from the top to bottom with time at control conditions (c), Ado (d), and sodium current (INa) 20% blockade (e). Blue and red numbers indicate the conduction time from SAN leading pacemaker through SAN and SACP, respectively. f Left: Ado plus INa blockade reproduced prolonged SCL and SAN exit block. Right: representative APs and derivatives. Ado adenosine, RA right atria, SACP sinoatrial conduction pathway, SACT sinoatrial conduction time, SAN sinoatrial node.

