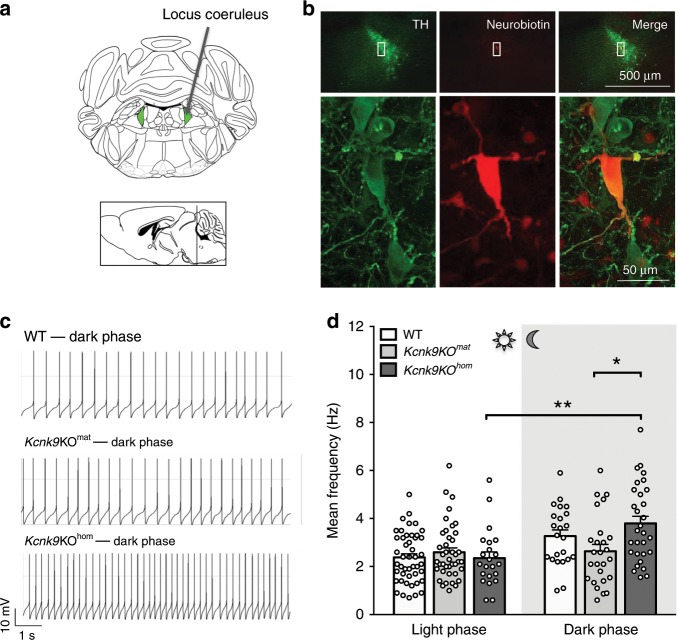
Fig. 3. Electrophysiological analysis of LC neurons.
a Schematic overview of the locus coeruleus (LC) and its position in the adult mouse brain, bregma −5.40 and −5.52 (the coordinates were according to the mouse brain atlas43). Green triangles represent the LC. b Confocal images showing TH-positive signal (green), neurobiotin-positive signal (red) and a merge of both signals (yellow). Upper images show an overview of the LC at a low-magnification (×4) and lower images display signals of analyzed single-cell at high-magnification (×60 oil). c Electrophysiological traces of single cells in the night phase of WT, Kcnk9KOmat and Kcnk9KOhom animals. Recordings from synaptically isolated spontaneously active LC neurons reveal increased pacemaker frequency in LC neurons from Kcnk9KOhom mice during dark phase. d Scatter dot-plot of mean frequencies including all analyzed cells in the day and night phase of WT (light n = 46, N = 5, dark n = 23, N = 3), Kcnk9KOmat (light n = 41, N = 5, dark n = 26, N = 4) and Kcnk9KOhom (light n = 22, N = 3, dark n = 30, N = 5) animals. Ordinary one-way ANOVA with Bonferroni’s multiple comparison post hoc test, *P < 0.05, **P < 0.01. Values are means ± SEM. N = number of mice, n = total number of cells. Statistical analyses and approaches are provided in Supplementary Table 1. Source data are provided as a Source Data file.

