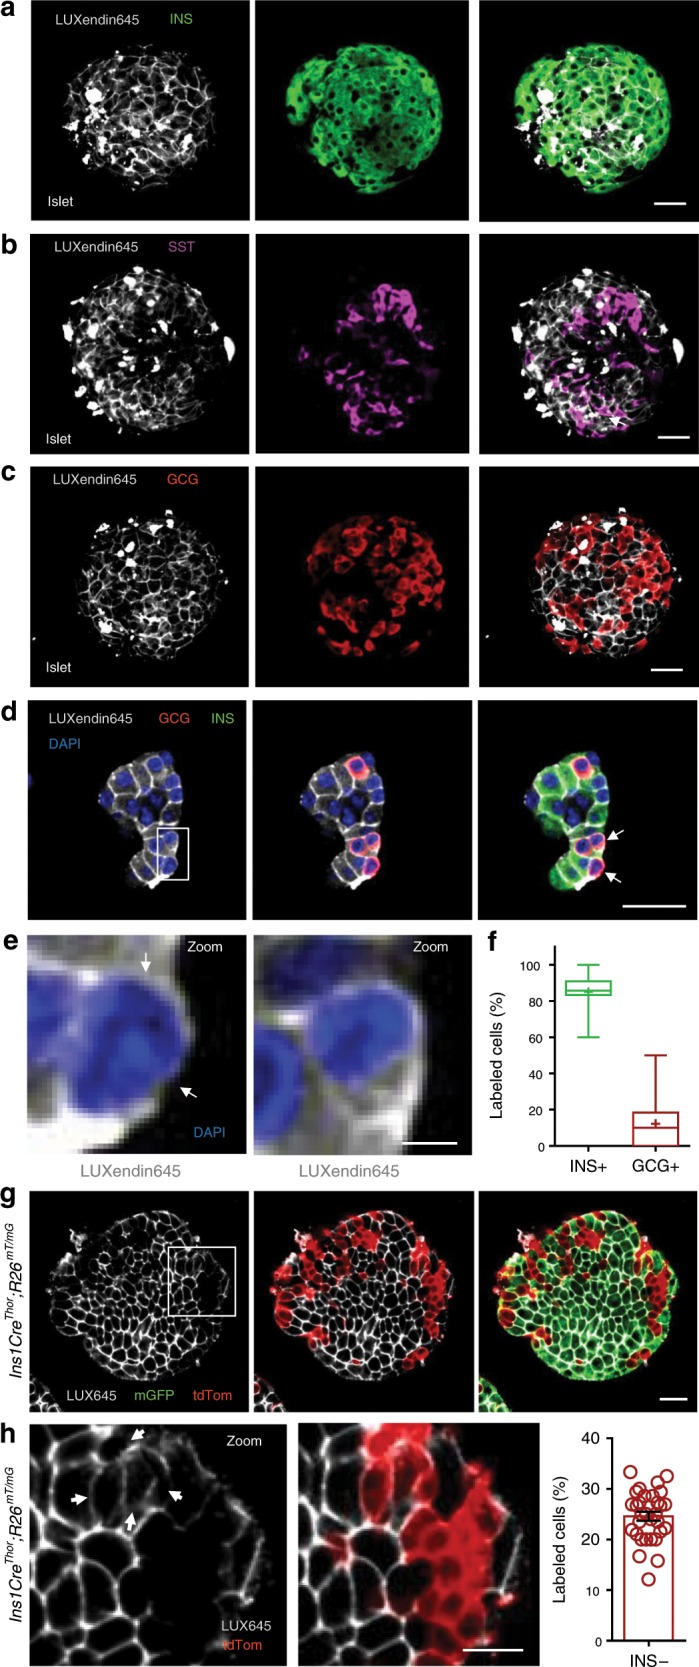
Fig. 4. LUXendin645 reveals GLP1R expression in a subpopulation of α-cells.

a–c LUXendin645 labeling is widespread throughout the intact islet, co-localizing predominantly with β-cells a and δ-cells b, but less so with α-cells c stained for insulin (INS), somatostatin (SST), and glucagon (GCG), respectively (n = 18 islets, seven animals, three separate islet preparations) (scale bar = 26 µm). d Following dissociation of islets into cell clusters, LUXendin645 labeling can be more accurately quantified (arrows highlight cells selected for zoom-in) (scale bar = 26 µm). e Zoom-in of d showing a LUXendin645− (left) and LUXendin645+ (right) α-cell (arrows highlight non-labeled cell membrane, which is not bounded by a β-cell) (scale bar = 26 µm). f Box-and-whiskers plot showing proportion of β-cells (INS) and α-cells (GCG) co-localized with LUXendin645 (n = 18 cell clusters, ten animals, three separate islet preparations) (box and whiskers plot shows range and median; mean is shown by a plus symbol). g Ins1CreThor;R26mT/mG dual fluorophore reporter islets express tdTomato until Cre-mediated replacement with mGFP, allowing identification of β-cells (~80% of the islet population) and non-β-cells for live imaging (scale bar = 26 µm). LUXendin645 (LUX645) highlights GLP1R expression in nearly all β-cells but relatively few non-β-cells (n = 31 islets, six animals, three separate islet preparations). h A zoom-in of the islet in g showing GLP1R expression in some non-β-cells (left) together with quantification (right) (arrows show LUXendin645-labeled non-β cells) (scale bar = 12.5 µm) (scatter dot plot shows mean ± s.e.m.). White boxes show the location of zoom-ins. In all cases, LUXendin645 was applied at 100 nM. Source data are provided as a Source Data file.
