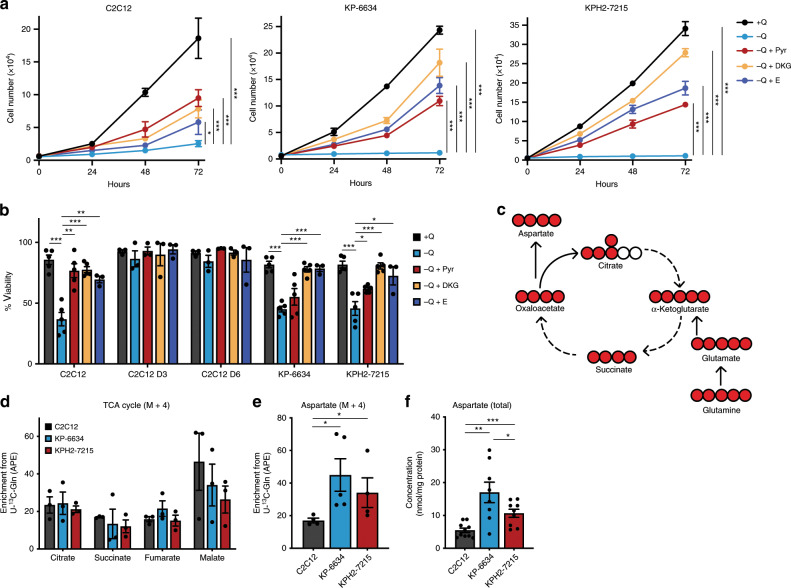
Fig. 2. UPS tumours cells maintain glutamine anaplerosis.
a Proliferation of C2C12s, KP-6634s, and KPH2-7215s (left to right) grown in media with or without glutamine (Q), supplemented with 5 mM pyruvate (Pyr), 5 mM dimethyl 2-oxoglutarate (DKG), or 2 mM glutamate (E). N = 3 with three technical replicates. Data represent mean ± s.e.m.; *p < 0.05, ***p < 0.0005. b Viability of C2C12, C2C12 D3, C2C12 D6, KP-6634, and KPH2-7215 cells grown in media with or without Q, supplemented with 5 mM Pyr, 5 mM DKG, or 2 mM E and assessed after 48 h. N = 3 with two technical replicates. Data represent mean ± s.e.m.; *p < 0.05, **p < 0.005, ***p < 0.0005. c Schematic depicting the TCA cycle and production of aspartate. Filled red circles represent 13C atoms derived from U-13C-glutamine. d Mass isotopomer analysis of M + 4 enrichment in citrate, succinate, fumarate, and malate, represented as atom percent excess (APE), in C2C12s, KP-6634s, and KPH2-7215s cultured for 5 h with U-13C-glutamine. N = 3 with two technical replicates. Data represent mean ± s.e.m. e Mass isotopomer analysis of M + 4 enrichment in aspartate, represented as APE, in C2C12s, KP-6634s, and KPH2-7215s cultured for 5 h with U-13C-glutamine. N = 3 with two technical replicates. Data represent mean ± s.e.m.; *p < 0.05. f Total aspartate levels in C2C12s, KP-6634s, and KPH2-7215s via HPLC. N = 4 with two technical replicates. Data represent mean ± s.e.m.; *p < 0.05, **p < 0.005, ***p < 0.0005. p-Values were calculated from a two-tailed Student’s t-test for a, b, d–f. Source data are provided as a Source Data file.

