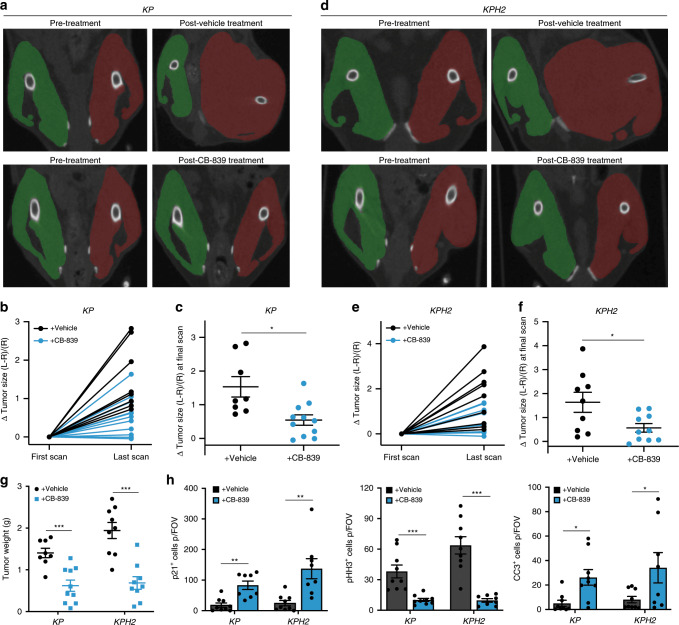
Fig. 7. CB-839 is effective in an autochthonous UPS model.
a Representative computed tomography (CT) scans of KP mice pre- and post-treatment with vehicle (n = 8) or CB-839 (n = 10) following up to 16 days of treatment. Right control (green) and left tumour-bearing (red) limbs are highlighted. b Change in tumour size as quantified from the relative difference in size of the two limbs normalized to the control limb in KP vehicle- (n = 8) or CB-839-treated (n = 10) mice. c Change in tumour size at final CT scan following vehicle (n = 8) or CB-839 treatment (n = 10) in KP mice. Error bars are ± s.d.; *p < 0.05. d Representative CT scans of KPH2 mice pre- and post-treatment with vehicle (n = 9) or CB-839 (n = 10) following up to 21 days of treatment. Right control (green) and left tumour-bearing (red) limbs are highlighted. e Change in tumour size as quantified from the relative difference in size of the two limbs normalized to the control limb in KPH2 vehicle- (n = 9) or CB-839-treated (n = 10) mice. f Change in tumour size at final CT scan following vehicle (n = 9) or CB-839 treatment (n = 10) in KPH2 mice. Error bars are ± s.d.; *p < 0.05. g Tumour weights from vehicle- and CB-839-treated KP (vehicle n = 8; CB-839 n = 10) and KPH2 (vehicle n = 9; CB-839 n = 10) mice. Error bars are ± s.e.m.; ***p < 0.0005. h Quantification of p21+, phospho-histone H3+ (pHH3), and cleaved-caspase 3+ (CC3) cells per field of vision (FOV) in vehicle- and CB-839-treated animals (left to right). N = 8 with five images taken per section. Data represent mean ± s.e.m.; *p < 0.05, **p < 0.005, ***p < 0.0005. p-Values were calculated from a two-tailed Student’s t-test for c, f–h. Source data are provided as a Source Data file.

