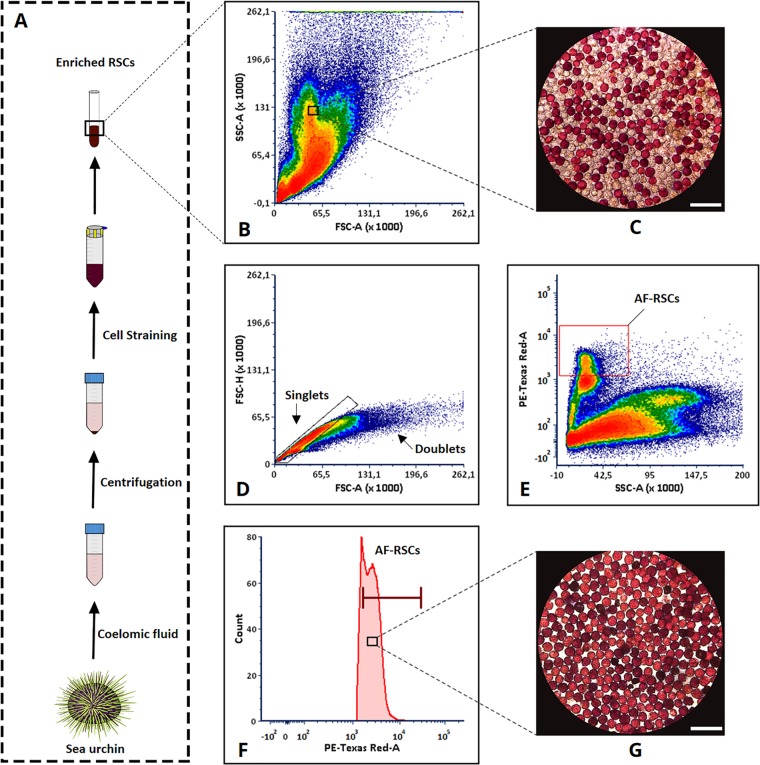
Figure 2.
Flow cytometry based autofluorescent (AF) RSCs sorting. Here, FCS Express 6.06.0014 (De Novo Software) generated two-parameter density plot shows the density of cells at a given position represented by different colours. (A) Sampling of coelomocytes and RSCs enrichment. The density plot represents; (B) Forward/Scatter profile of live unstained coelomocyte. (C) Microscopic image of RSCs and other cells before sorting. (D) Gating of singlets allowing discrimination of doublets and (E) Gating of distinct fluorescent RSCs population represented by the red box. (F) Histogram of fluorescent RSCs population. The histogram marker presents the selective population to be sorted. (G) Microscopic image of pure AF-RSCs after sorting. Microscopic image scale bar 50 µm.

