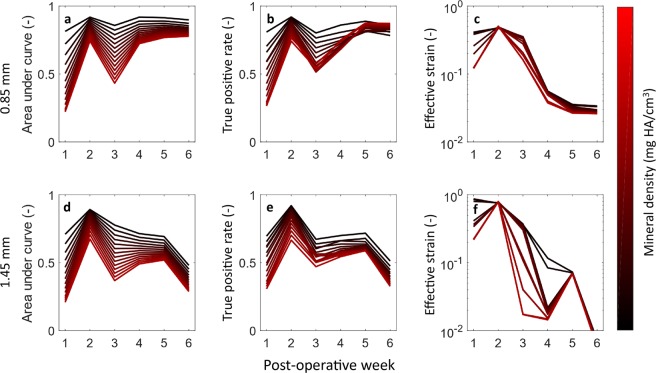
Figure 3.
The associations between mineralisation on the mechanical local in vivo environment: Time course of area under curve (AUC) (a,d), True positive rate (b,e) and Effective Strain thresholds (c,f) for 0.85 mm (upper row) and 1.45 mm (lower row) defects. (a,d) The area under curve for the 0.85 mm and 1.45 mm respectively. In both groups the AUC was maximum in the second week. The AUC declined in the third week for both groups, this decline was largest for the highest mineralised tissue, again recovering for the 0.85 mm, while continuing to decline for the 1.45 mm group. The poor association between the formation of highly mineralised tissue and mechanical signal in the third week is an indication that the maturation of bone is independent of the local mechanics while its formation is dependent. The recovery of the AUC in the later weeks for the 0.85 mm is likely due to the group containing only mice with unions. The true positive rate of the optimal threshold (b,e), initially show a similar trend to the AUC. However, for the 0.85 mm group the association for the highest mineral density threshold is also highest in the final week, indicating that controlled remodelling is taking place. The optimal effective strain thresholds (c,f) show a similar level of strain in the second week. A large amount of variation with respect to mineral density threshold can be seen in the 1.45 mm group from week 3 onwards, which is likely due to the presence of both unions (which stress shield soft tissue) and non-unions in the group.

