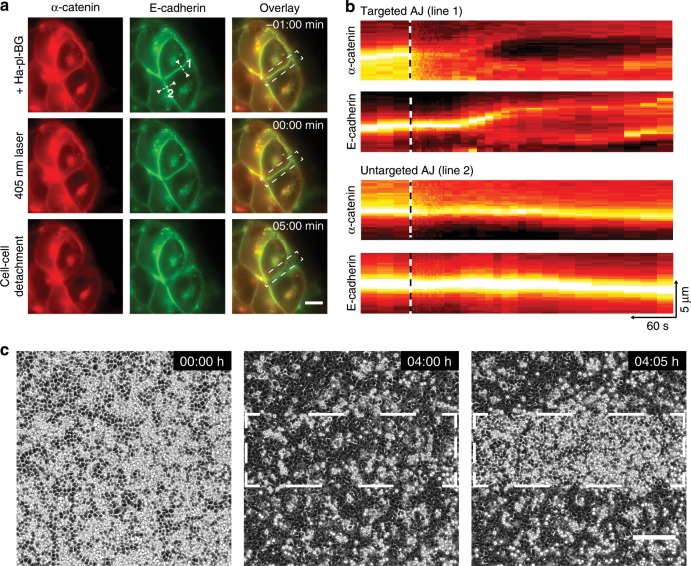
Fig. 3. Multiscale targeting of AJs assembly and disassembly with high spatial precision.
a For visualization in live cell experiments, E-cadherin (shown in green) and α-catenin (shown in red) are tagged with GFP and mCherry, respectively. Targeted dissociation of Ha-pl-BG reconstituted AJs with subcellular precision before (upper row) directly after (middle) and 5 min after 405 nm laser area scanning (white dashed rectangular in the overlay). Scale bar 10 µm. b Kymograph analysis of E-cadherin and α-catenin intensities of targeted (line 1) and untargeted (line 2) AJs in a. The time point of laser scanning is indicated as black and white dashed lines. Scale as indicated by arrows in the lower right. c Monolayer compaction via AJ reconstitution after addition of Ha-pl-BG leads to reintegration of the loosely attached cells in a monolayer. After 4 h, the white dashed outlined area was scanned with a 405 nm laser. Note that only cells in the targeted area change their morphology and push out excess cells immediately. Scale bar 200 µm.

