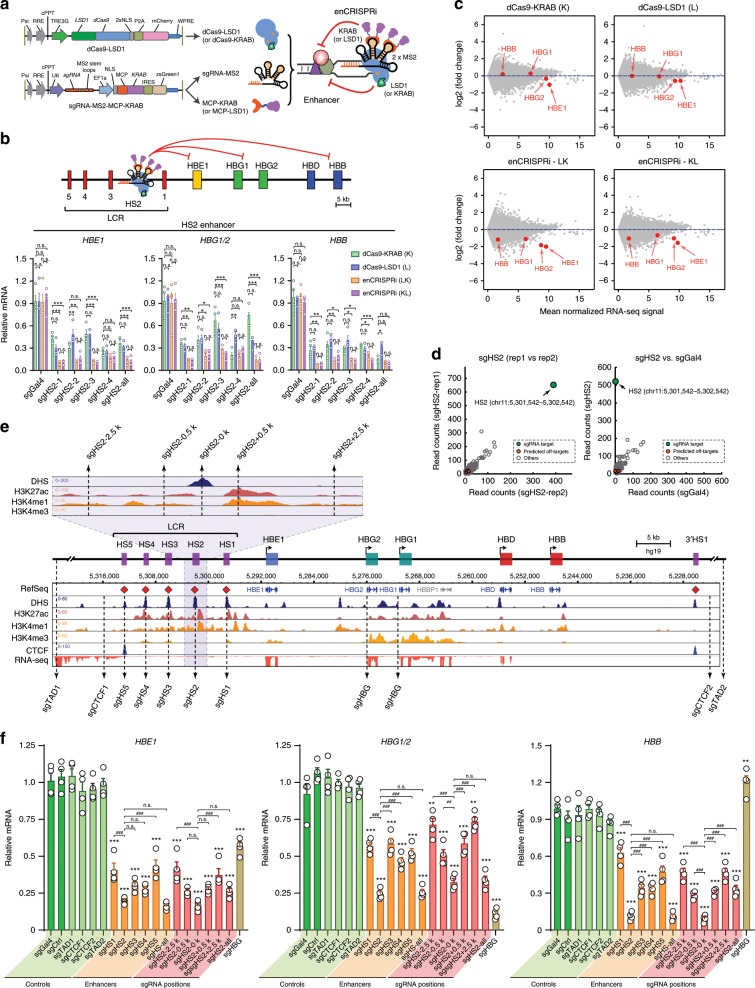
Fig. 2. Development of the dual-repressor enCRISPRi system.
a Schematic of enCRISPRi containing a dCas9-LSD1 fusion protein, the sgRNA with two MS2 hairpins, and the MCP-KRAB fusion protein. b Expression of β-globin genes in K562 cells upon dCas9-KRAB (K), dCas9-LSD1 (L) or enCRISPRi (LK and KL)-mediated repression of the HS2 enhancer using four HS2-targeting sgRNAs individually (sgHS2-1 to sgHS2-4) or combined (sgHS2-all). The nontargeting sgGal4 was analyzed as the control. mRNA expression relative to nontransduced cells is shown as mean ± SEM (n = 4 experiments) and analyzed by a two-way ANOVA. *P < 0.05, **P < 0.01, ***P < 0.001, n.s. not significant. c RNA-seq profiles in K562 cells upon dCas9-KRAB, dCas9-LSD1 or enCRISPRi-mediated repression of the HS2 enhancer using four sgRNAs (sgHS2-all). Scatter plot is shown for each gene by the mean of log2 normalized RNA-seq signals as transcripts per million or TPM (n = 2 experiments) (x axis) and log2 fold changes of mean TPM in cells expressing sgHS2 and nontransduced cells (y axis). β-globin genes are indicated by red arrowheads. d Genome-wide analysis of dCas9 binding in K562 cells expressing HS2-specific sgRNA (sgHS2-rep1 and sgHS2-rep2) or nontargeting sgGal4. Data points for the sgRNA target regions and the predicted off-targets are shown as green and red, respectively. e Density maps are shown for DHS, ChIP-seq of H3K27ac, H3K4me1, H3K4me2, CTCF, and RNA-seq at the β-globin cluster (chr11: 5,222,500–5,323,700; hg19). The zoom-in view of the HS2 proximity region is shown on the top. Dashed lines denote the positions of sgRNAs. f Expression of β-globin genes in K562 cells coexpressing enCRISPRi and target-specific sgRNAs at various positions within the β-globin cluster, control sgRNAs (sgCtrl, sgTAD1, sgTAD2, sgCTCF1 and sgCTCF2) or nontargeting sgGal4. mRNA expression relative to nontransduced cells is shown as mean ± SEM. The differences between control sgGal4 and other sgRNAs were analyzed by a one-way ANOVA. *P < 0.05, **P < 0.01, ***P < 0.001, n.s. not significant. The differences between sgHS2 and other sgRNAs were analyzed by a one-way ANOVA. ##P < 0.01, ###P < 0.001. Source data are provided as a Source Data file.

