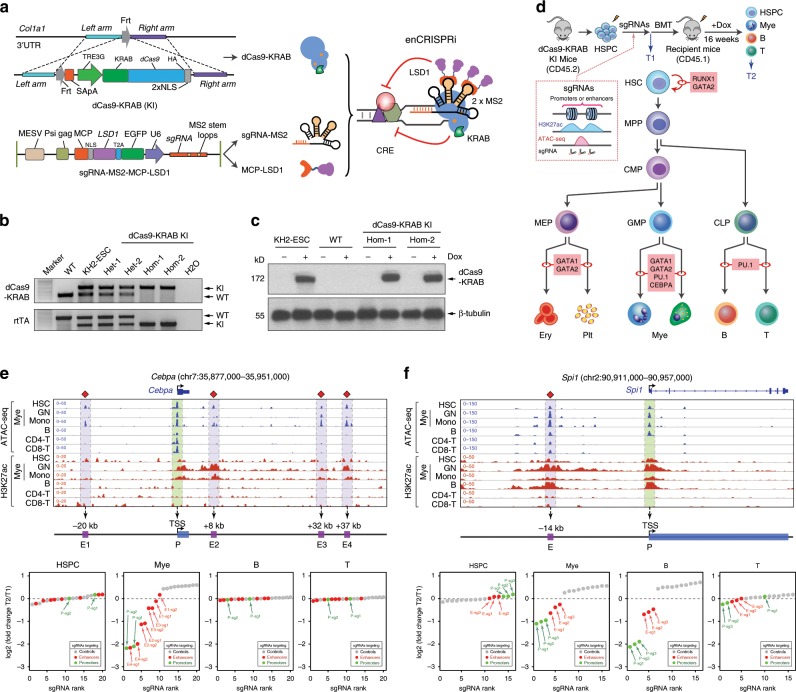
Fig. 5. Locus-specific in vivo enhancer perturbation.
a Schematic of site-specific KI of tetracycline-inducible dCas9-KRAB into the Col1a1 locus. Coexpression of dCas9-KRAB, sgRNA-MS2 and MCP-LSD1 leads to assembly of enCRISPRi complex in vivo. b Validation of dCas9-KRAB and rtTA KI or WT alleles by genotyping PCR. C57BL/6 WT mouse and targeted KH2-ESC were used as controls. Two independent heterozygous (Het) and homozygous (Hom) KI mice were analyzed. c Dox-inducible expression of dCas9-KRAB fusion protein was confirmed by Western blot in the targeted KH2-ESC and two independent dCas9-KRAB KI mice. β-tubulin was analyzed as the loading control. d Schematic of in vivo perturbation of lineage-specific enhancers in dCas9-KRAB KI mice. e In vivo enCRISPRi perturbation of Cebpa CREs revealed lineage-specific requirement of Cebpa enhancers during hematopoiesis. Waterfall plots are shown for target-specific sgRNAs (green and red dots) and nontargeting control sgRNAs (gray dots) by the mean normalized log2 fold changes in HSPCs, myeloid, T or B cells 16 weeks post BMT (T2) relative to pooled sgRNA-transduced HSPCs (T1) from two independent replicate screens (n = 3 recipient mice per screen). Density maps are shown for ATAC-seq and H3K27ac ChIP-seq at the Cebpa locus (chr7:35,877,000–35,951,000; mm9) in bone marrow HSC, granulocytes (GN), monocytes (Mono), B, CD4+ and CD8+ T cells, respectively. The annotated Cebpa promoter (P) and enhancers (E1 to E4) are indicated by green and blue shaded lines. Results from independent replicate screens and statistical analyses are shown in Supplementary Fig. 7a, b. f In vivo enCRISPRi perturbation of Spi1 CREs during hematopoiesis. Density maps are shown for ATAC-seq and H3K27ac ChIP-seq at the Spi1 locus (chr2:90,911,000–90,957,000; mm9) in bone marrow HSC, GN, Mono, B, CD4+ and CD8+ T cells, respectively. The annotated Spi1 promoter (P) and enhancer (E) are indicated by green and blue shaded lines. Results from independent replicate screens and statistical analyses are shown in Supplementary Fig. 7c, d. Source data are provided as a Source Data file.

