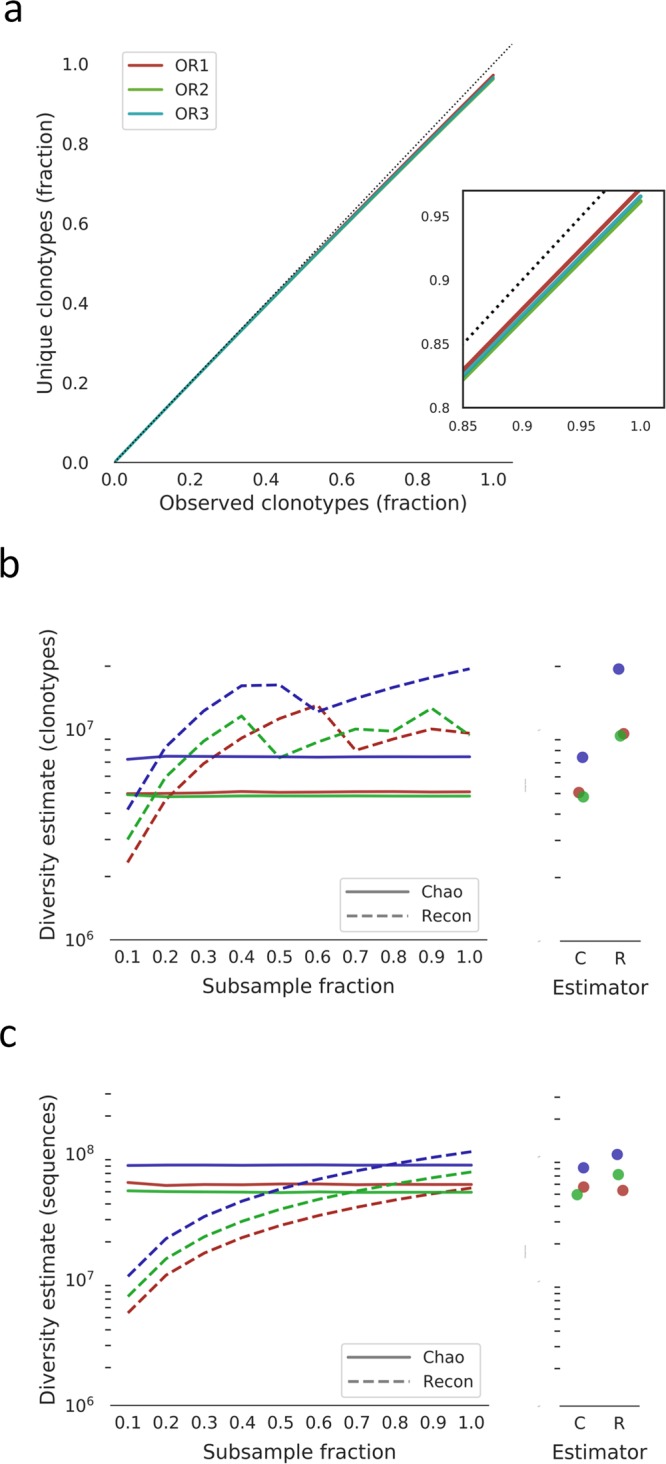
Figure 3.

Clonotype and sequence diversity of the OmniRat antibody heavy chain repertoire. (a) Clonotype rarefaction curves for each animal. Lines represent the mean of 10 independent samplings, except for the 1.0 fraction which was sampled once. The dashed line indicated a perfectly diverse sample. Inset is a close-up of the rarefaction curve ends. (b) Total clonotype repertoire diversity estimates were computed for increasingly large fractions of each animal’s clonotype repertoire. Lines represent the mean of 10 independent samplings, except for the 1.0 fraction which was sampled once. Chao estimates are shown in solid lines and Recon estimates are shown in dashed lines. Lines are colored as in (a). Maximum diversity estimates (from the 1.0 fraction) for each animal is shown in the panel on the right. (b) Total sequence repertoire diversity estimates were computed for increasingly large fractions of each animal’s sequence repertoire. Lines represent the mean of 10 independent samplings, except for the 1.0 fraction which was sampled once. Chao estimates are shown in solid lines and Recon estimates are shown in dashed lines. Lines are colored as in (a). Maximum diversity estimates (from the 1.0 fraction) for each animal are shown in the panel on the right.
