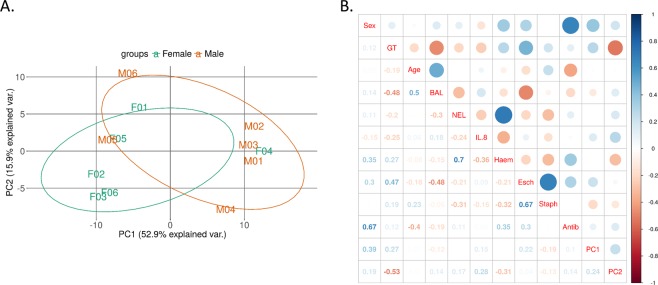
Figure 1.
(A) Principal component analysis (PCA) was performed on samples after removal of lowly expressed miRNAs (Ct >25) and normalisation of Ct values. (B) Correlation plots showing the correlation between sex, genotype (GT), age, BAL Total cell count (BAL), neutrophil elastase levels (NEL), IL-8 concentration (IL-8), Haemophilus spp. (Haem), Escherichia spp. (Esch), Staphyloccus spp. (Staph), antibiotic treatment (Antib), PC1 and PC2. The size of the circles is proportional to the strength of the correlation and the colour represents the direction i.e. a large dark blue circle represents a strong positive correlation and a large dark red circle represents a strong negative correlation.

