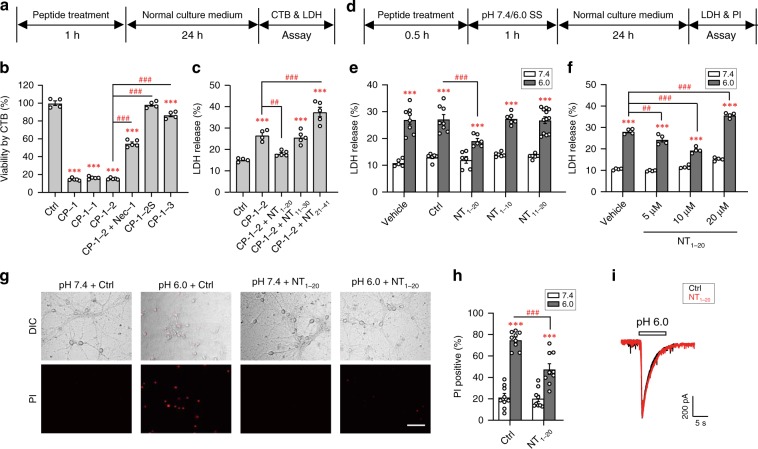
Fig. 1. Peptide NT1–20 protects mouse cortical neurons against acidosis-induced necroptosis.
a Schematics of cell death assays for (b, c). CTB, cell titer blue; LDH, lactate dehydrogenase. b CTB assay for viability of neurons treated with indicated peptides (all at 10 μM). CP-1, CP-1-1, CP-1-2 and CP-1-3 reduced viability. Nec-1 (20 μM) attenuated CP-1-2 induced death. Compared to CP-1-2, CP-1-3 induced much less and the membrane impermeable CP-1-2S induced no death. n = 4–6, *** p < 0.001 vs. control peptide (Ctrl, TAT alone), ### p < 0.001 vs. CP-1-2, by ANOVA. c LDH release assay for viability of neurons treated with CP-1-2 (10 µM) without or with NT peptides (10 µM). The toxicity by CP-1-2 was significantly reduced by NT1–20, but not NT11–30 and NT21–41. n = 4–5, *** p < 0.001 vs. Ctrl, ## p < 0.01, ### p < 0.001 vs. CP-1-2, by ANOVA. d Schematics of cell death assay for (e–h). PI, propidium iodide (PI); SS, standard extracellular solution. e LDH release from neurons exposed to pH 7.4 and pH 6.0 SS. pH 6.0-induced death was reduced by treatment of 10 µM NT1–20, but not NT1–10 and NT11–20. n = 5–12, *** p < 0.001 vs. corresponding pH 7.4, ### p < 0.001 vs. Ctrl in pH 6.0, by ANOVA. f Concentration dependence of NT1–20 suppression of acidotoxicity. n = 4, *** p < 0.001 vs. corresponding pH 7.4, ## p < 0.01, ### p < 0.001 vs. vehicle in pH 6.0, by ANOVA. g DIC (upper) and PI staining (lower) images of neurons treated as in (d). Scale bar, 50 µm. h Summary for (g). n > 200 neurons counted for each. *** p < 0.001 vs. corresponding pH 7.4, ### p < 0.001 vs. Ctrl in pH 6.0, by ANOVA. i Pretreatment (0.5 h) with 10 μM NT1–20 had no effects on pH 6.0-induced currents in cultured neurons. Representative current traces at −60 mV are shown. Error bars are SEM for all summary panels.

