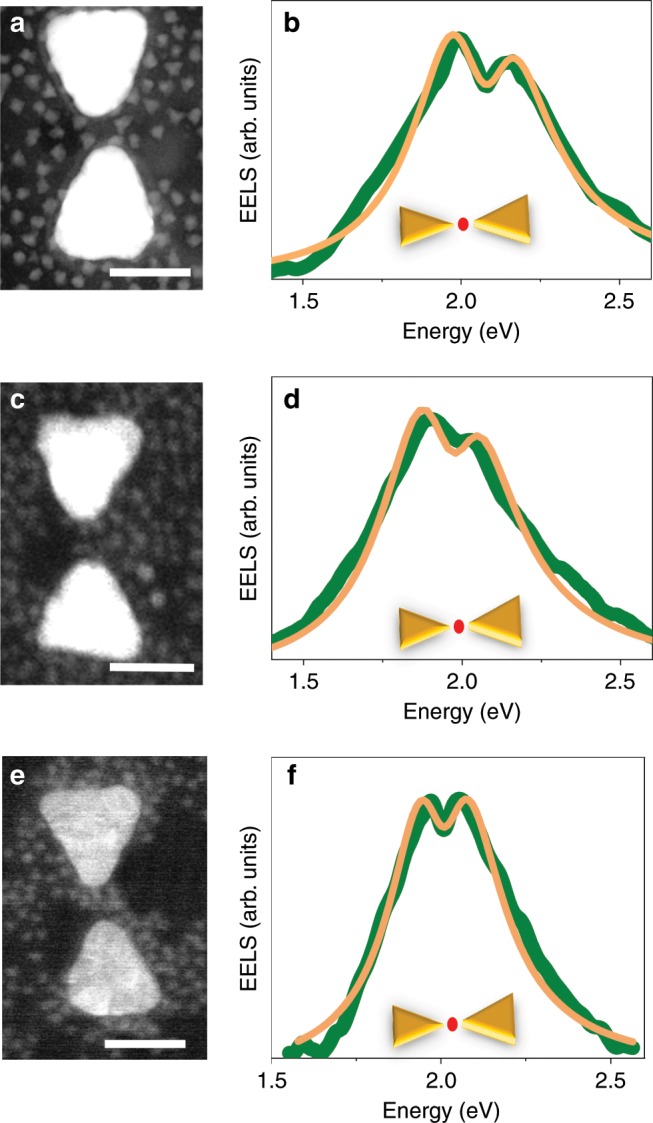
Fig. 3. Coupling with the dark dipolar mode.

a, c, e ADF-STEM images of three devices loaded with QDs with an exciton energy of 2.0 eV. The scale bars represent 50 nm. b, d, f EEL spectra of the dark mode of the devices in a, c and e demonstrating Rabi splitting, as with the bright mode. Green curves are experimental data, and orange curves are fits to the coupled oscillator model, as described in the Methods section. Insets demonstrate the points of excitation by the electron beam.
