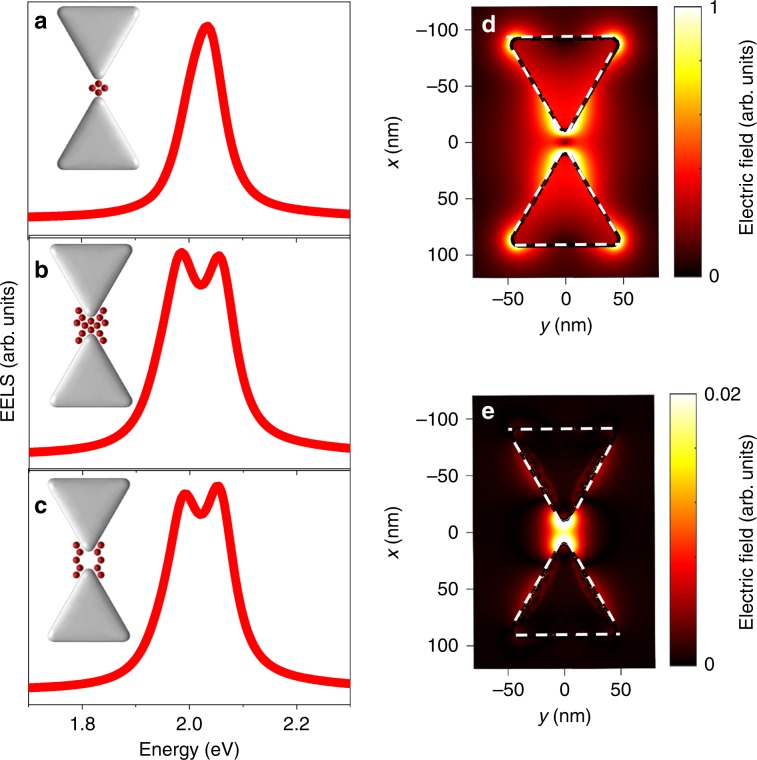
Fig. 4. EM simulations of dark mode coupling with the QDs.
a Dark mode spectrum when four QDs are positioned in the center of the gap. b Dark mode spectrum when ten additional dots are added at the periphery of the gap. c Dark mode spectrum with QDs positioned only at the gap periphery. d Map of total electric field distribution around the PC at 2 eV, projected on the x–y plane. e Map of the out-of-plane electric field distribution around the PC at 2 eV, projected on the x–y plane. The maps in d and e were calculated for bowties without QDs. Note their different color scales.

