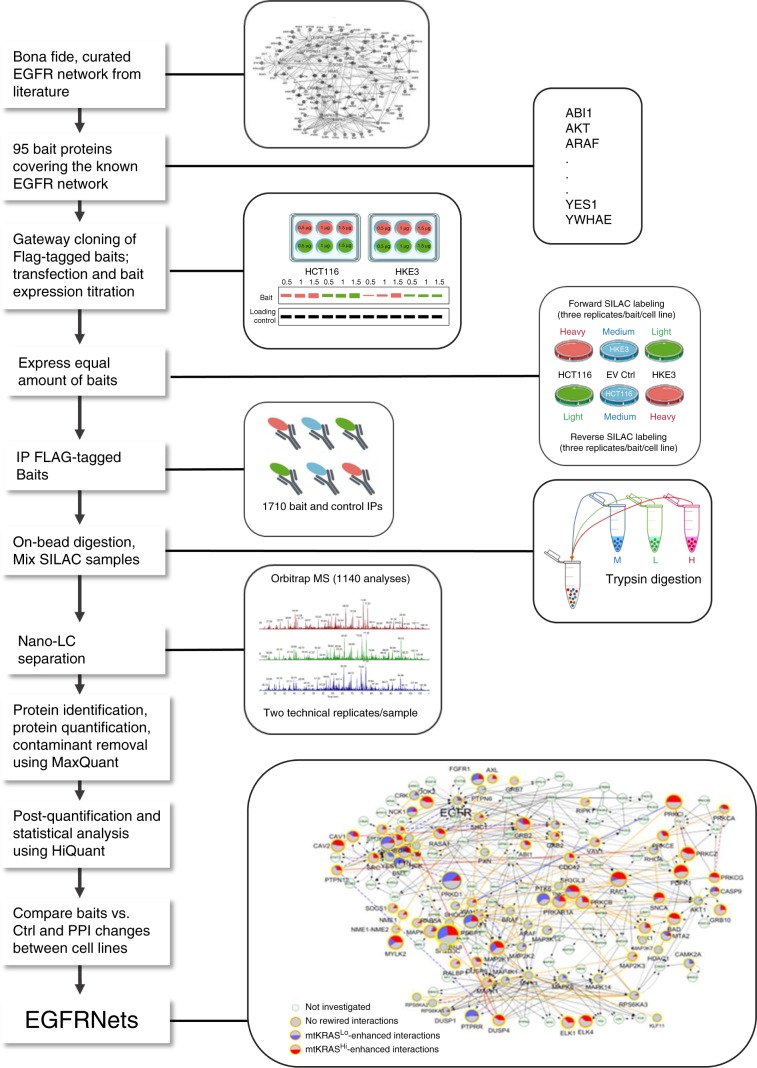
Fig. 1. Experimental and data analysis workflow for the comparative mapping of PPIs in the EGFR network.
Baits were chosen based on the core EGFR network described by Kiel et al.18 and additional manually curated literature information. Flag-tagged expression vectors were constructed using the Gateway cloning system and transfected into HCT116 (mtKRASHi) and HKE3 (mtKRASLo) cells. Careful titration of the transfected plasmids ensured similar protein expression in both cell lines grown in SILAC media as monitored by Western blotting. For MS experiments similar amounts of baits were expressed in SILAC labeled HCT116 and HKE3 cells and immunoprecipitated (IP) with anti-Flag antibodies. To assure robust quantitation the SILAC label was swapped, i.e. each bait was isolated from HCT116 and HKE3 cells grown in heavy or light medium, respectively. After trypsin digestion peptides were identified and quantified by orbitrap mass spectrometry. Raw data were analysed using MaxQuant59 and further processed using HiQuant19 implementing a stringent pipeline to retain only true interactors. Based on these data two quantitative protein–protein interaction networks, termed EGFRNetmtKRAS-Hi and EGFRNetmtKRAS-Lo, were reconstructed and are shown in a combined differential network representation. EV Ctrl, empty vector control transfection.

