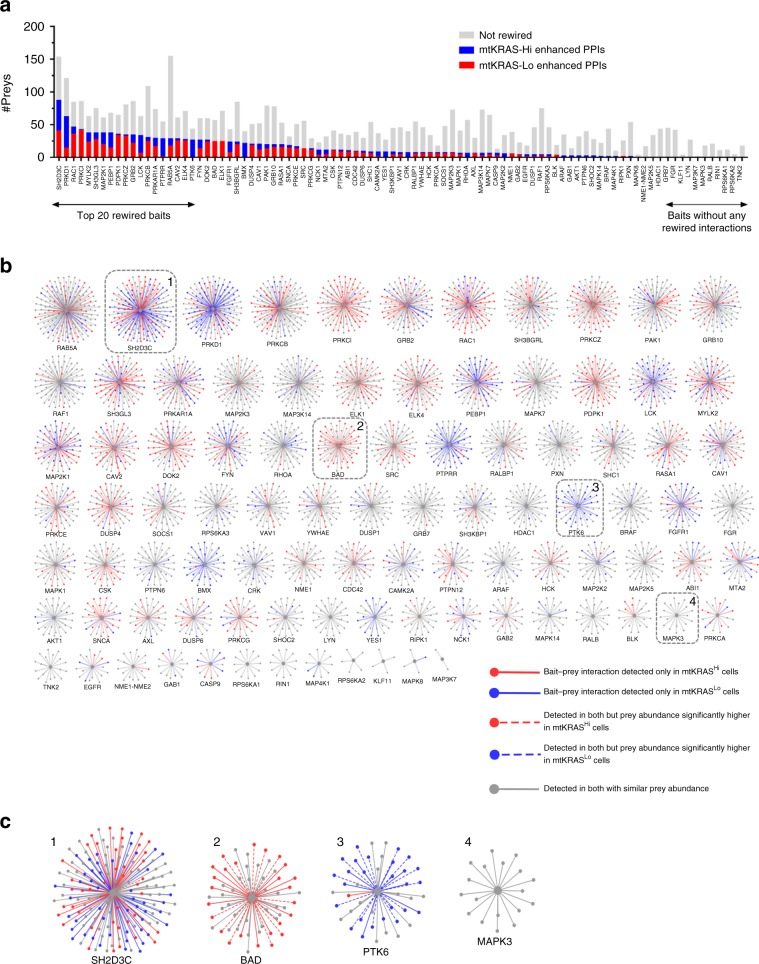
Fig. 2. The EGFRNetmtKRAS-Hi and EGFRNetmtKRAS-Lo PPINs are rewired.
a The number of preys identified for each bait-prey AP-MS complex. Red, rewired preys enhanced in mtKRASHi cells; blue, rewired prey proteins enhanced in mtKRASLo cells. AP-MS complexes are named based on the bait protein and are shown on the x-axis. b Network spoke model view of rewired interactions. Bait–prey interactions identified in both networks with similar prey abundance are shown in gray. Bait–prey interactions that were identified only in EGFRNetmtKRAS-Hi or EGFRNetmtKRAS-Lo are shown as solid red or blue edges, respectively. Bait–prey interactions that were detected in both networks but where prey abundance was significantly higher in EGFRNetmtKRAS-Hi or EGFRNetmtKRAS-Lo are shown as dotted red or blue edges, respectively. Visit primesdb.eu to explore the complexes in more detail/with greater resolution. c Zoom-in on four nodes that represent mixed, preferential or no rewiring. Source data are provided as a Source Data file.

