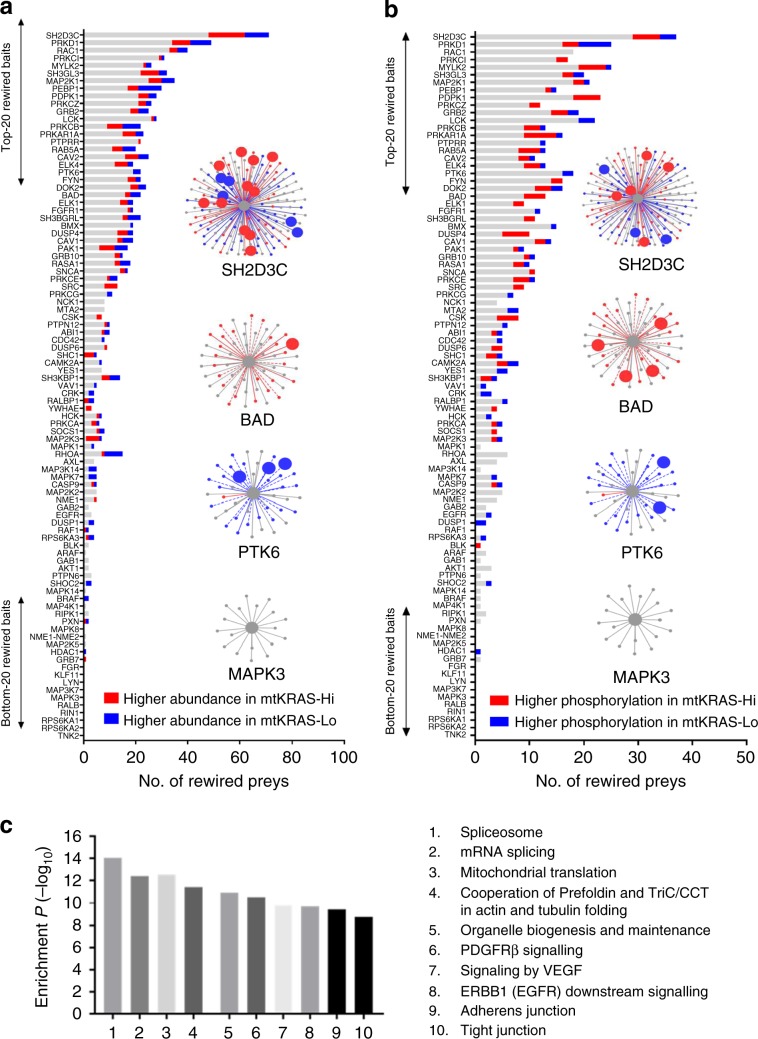
Fig. 3. Potential drivers of the EGFR PPI network rewiring.
a The number of rewired prey proteins for each bait-prey AP-MS complex that were assessed for differential protein expression between the two cell lines. Rewired prey proteins that were significantly more abundant in the mtKRASHi cells are shown in red. Rewired prey proteins that were significantly more abundant in the mtKRASLo cells are shown in blue. Four selected AP-MS complexes highlighting differentially abundant prey proteins (larger nodes) are also shown. b The number of rewired prey proteins for each bait-prey AP-MS complex that were assessed for differential phosphorylation between the two cell lines. Rewired prey proteins that were significantly more phosphorylated in the mtKRASHi cells are shown in red. Rewired prey proteins that were significantly more phosphorylated in the mtKRASLo cells are shown in blue. Four selected AP-MS complexes highlighting differentially phosphorylated prey proteins (larger nodes) are also shown. c Statistically enriched pathways among the 735 prey proteins involved in rewired interactions. Source data are provided as a Source Data file.

