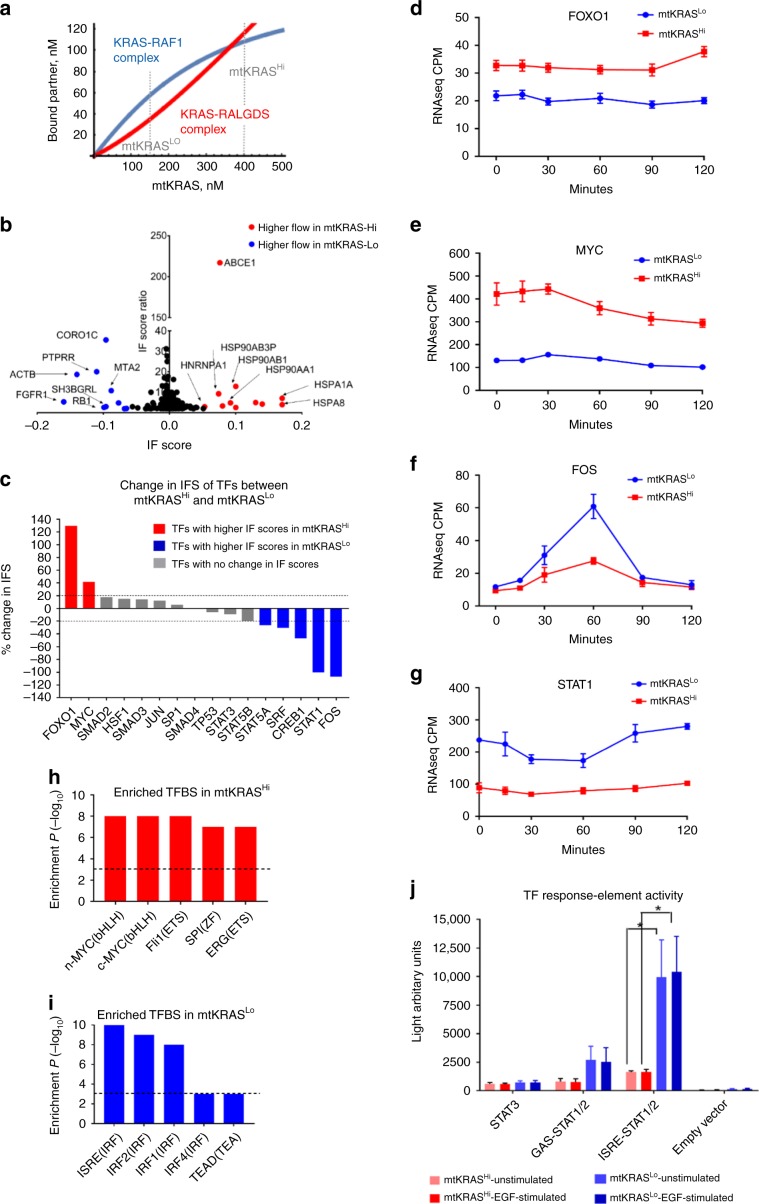
Fig. 5. KRAS effector pathway and information flow (IF) analysis of the EGFRNetmtKRAS-Hi and EGFRNetmtKRAS-Lo networks.
a Dependence of KRAS-effector complex concentrations of effectors binding with high (RAF1, blue) or low affinity (RALGDS, red) on the abundance of mtKRAS. Broken gray lines indicate KRAS concentrations in mtKRASLo and mtKRASHi cells. b Plot showing nodes in the top 5th percentile in terms of their IFS and predicted to receive more flow in EGFRNetmtKRAS-Hi (red) or EGFRNetmtKRAS-Lo (blue). c Transcription factors (TFs) with at least 20% higher information flow in EGFRNetmtKRAS-Hi (red) and EGFRNetmtKRAS-Lo (blue). Gene expression of d FOXO1, e MYC, f FOS, and g STAT1 as determined by RNAseq analysis of TGFα stimulated cells. ***EdgeR FDR < 0.001; ****EdgeR FDR < 0.0001. The top five enriched transcription factor binding (TFBS) site motifs in the promoters of genes upregulated in h mtKRASHi and i mtKRASLo cells. j Reporter gene assays of the activity of STAT1/2 and STAT3. Error bars represent standard deviation, and P values in K were determined by a two-tailed Student’s t-test. *P < 0.05; **P < 0.01. The data represent three independent experiments. Source data are provided as a Source Data file. Mathematica code for 5A is provided in Supplementary Software 1.

