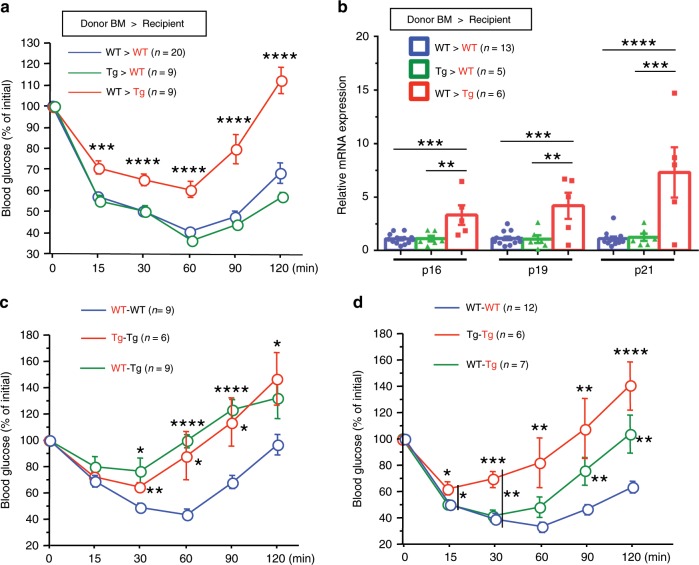
Fig. 8. EC senescence impairs metabolic health through the SASP.
a ITT in recipient WT or Tie2-TERF2DN-Tg mice harboring BM of WT or Tg mice (n = 20 biologically independent animals for WT>WT group; n = 9 biologically independent animals for Tg>WT group; n = 9 biologically independent animals for WT>Tg group). b CDK inhibitor expression in the WAT isolated from recipient WT or Tie2-TERF2DN-Tg mice harboring BM of WT or Tg mice (n = 13 biologically independent samples for WT>WT group; n = 5 biologically independent samples for Tg>WT group; n = 6 biologically independent samples for WT>Tg group). c ITT in the recipient WT or Tie2-TERF2DN-Tg mice whose circulation was shared with WT (recipient–donor; WT–WT, n = 9 biologically independent animals) or Tie2-TERF2DN-Tg mice (n = 9 biologically independent animals for WT-Tg group; n = 6 biologically independent animals for Tg–Tg group). d ITT in the donor WT or Tie2-TERF2DN-Tg mice whose circulation was shared with WT (WT–WT, n = 12 biologically independent animals) or Tie2-TERF2DN-Tg mice (n = 7 biologically independent animals for WT-Tg group; n = 6 biologically independent animals for Tg–Tg group). Non-repeated ANOVA with post hoc analysis of Fisher’s PLSD was used for difference evaluation between the groups (a–d). Data are presented as mean ± s.e. *P < 0.05, **P < 0.01, ***P < 0.001, and ****P < 0.0001. Source data are provided as a Source Data file.

