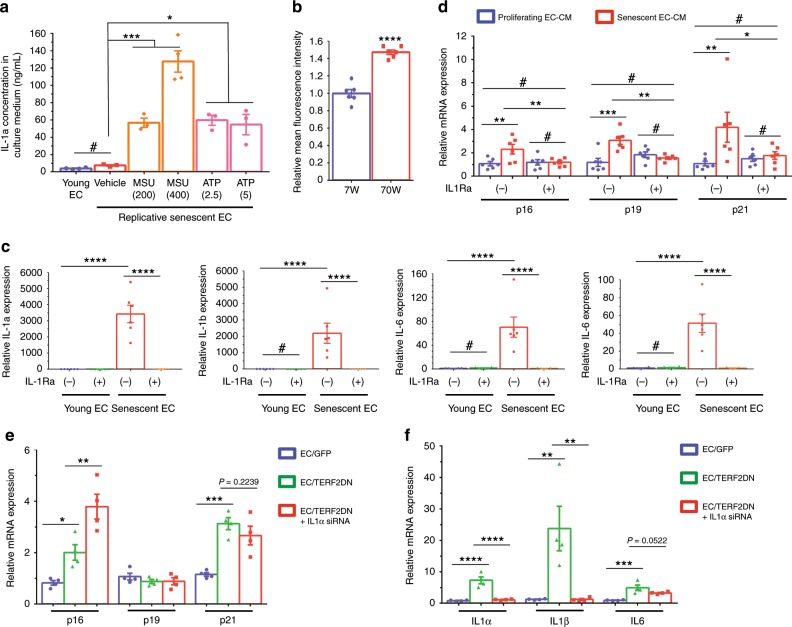
Fig. 9. IL-1a orchestrates senescence-associated cytokine networks in EC.
a IL-1a concentration in culture medium derived from young or replicative senescent EC in the presence or absence of inflammasome activators, such as monosodium urate crystal (MSU, 200 or 400 μg/mL) and adenosine triphosphate (ATP, 2.5 or 5 mM) (n = 4 biologically independent samples for young; n = 3 biologically independent samples for senescent EC). b FACS analysis of cell-surface IL-1a in ECs isolated from the lung of young (7W) or aged (70W) mice (n = 6 biologically independent samples each). A two-tailed Student’s t test was used for difference evaluation between the two groups. c SASP factor expression in young or replicative senescent EC in the presence or absence of IL-1 receptor antagonist (n = 6 biologically independent samples each). d CDK inhibitor expression in 3T3-L1 adipocytes treated with the conditioned medium derived from young or replicative senescent EC with or without IL-1 receptor antagonist treatment (n = 6 biologically independent samples each). e CDK inhibitor expression in young control EC (GFP), premature senescent EC (TERF2DN), or premature senescent EC transfected with IL-1a siRNA (n = 4 biologically independent samples each). f SASP factor expression in young control EC (GFP), premature senescent EC (TERF2DN), or premature senescent EC transfected with IL-1a siRNA (n = 4 biologically independent samples each). Non-repeated ANOVA with post hoc analysis of Fisher’s PLSD was used for difference evaluation between the groups (a, c–f). Data are presented as mean ± s.e. *P < 0.05, **P < 0.01, ***P < 0.001, ****P < 0.0001 and #not significant. Source data are provided as a Source Data file.

