
Figure 3: Network interactions with experimentally determined targets of miR-150-5p, miR-29a-3p, and miR-30a-5p.
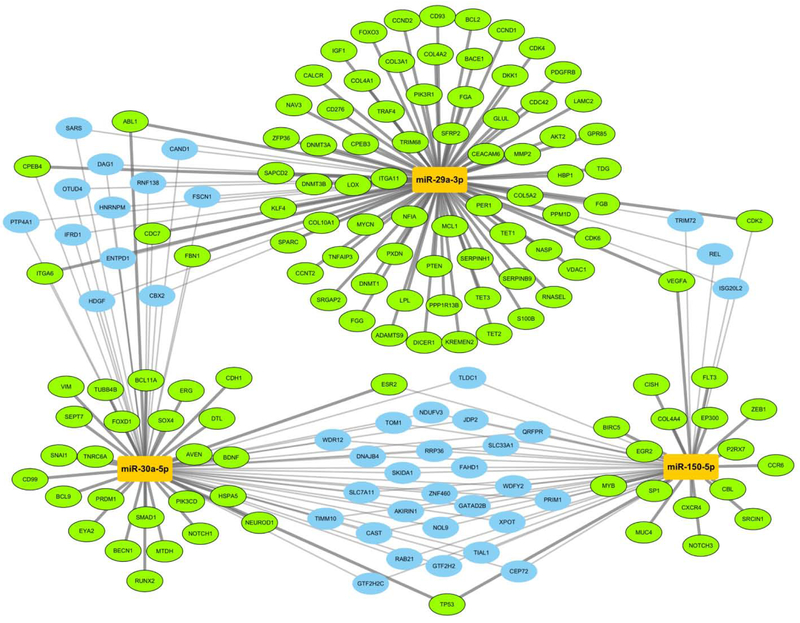
Gene targets (ovals) of the three miRNAs (orange rectangles) are connected by strong (thick) and weak (thin) evidence types according to miRTarBase. This subnetwork view focuses on 160 targets that either of have strong evidence for interacting with only one miRNA (green, radial layout), weak evidence to two or more miRNAs (blue, interstitial layout), or a mix of both (green, interstitial layout).