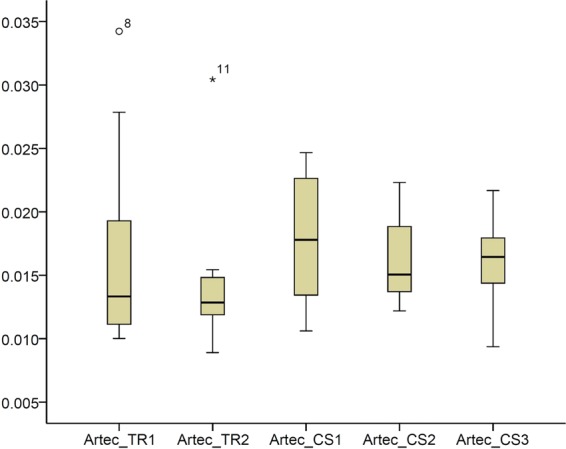
Figure 1.

Box plots showing the trueness of the repeated intraoral scans with two different scanners in millimeters (n = 12, p = 0.176, Friedman test). The upper limit of the black line represents the maximum value, the lower limit the minimum value, the box the interquartile range, and the horizontal line the median value. Outliers are shown as black dots or stars, in more extreme cases. CS1, CS2, CS3: CS3600 repeated scans. TR1, TR2: TRIOS3 repeated scans. Artec: Artec Space Spider scan.
