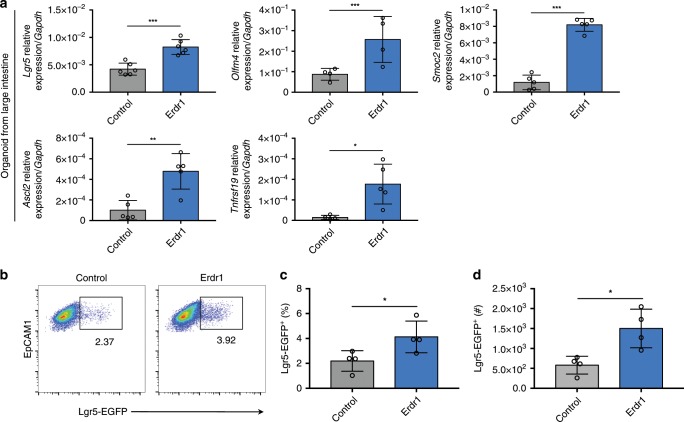
Fig. 4. Erdr1 induces ISC signature gene expression and Lgr5+ ISCs.
a Expression of stem cell signature genes (Lgr5, Olmf4, Smoc2, Ascl2, Tnfrsf19) in LI organoids from SPF mice cultured ±Erdr1 for 6 days. n = 4 (Olfm4), n = 5 (Smoc2, Ascl2, Tnfrsf19), n = 6 (Lgr5); representative of three experiments. b–d Frequency and cell numbers of Lgr5-EGFP+ cells (live cells, EpCAM1+, EGFP+) in SI organoids cultured ±Erdr1 for 6 days. n = 4; representative of three experiments. All data are presented as mean ± SD; *P < 0.05, **P < 0.01, ***P < 0.001 by unpaired, two-tailed t-tests.

