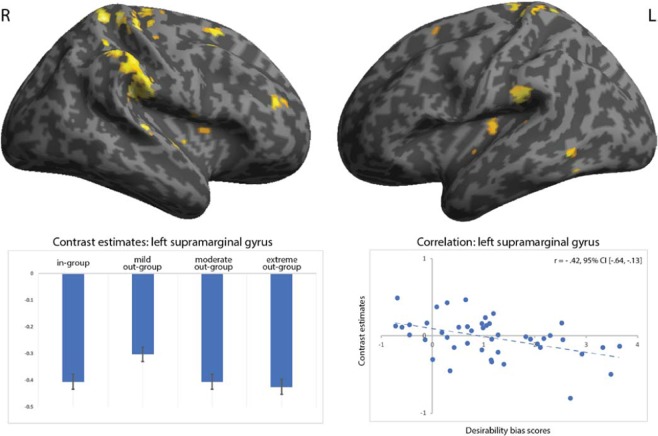
Figure 3.
Top two images depict right-side (R) and left-side (L) brain activation from the flexible factorial contrast 2 × (mild out-group − in-group) − [(moderate out-group − in-group) + (extreme out-group − in-group)]. For the labelling of these regions, please consult Supplementary Table S1. The bottom two images show parameter estimates for the four social groups in the left supramarginal gyrus (bottom left-side) and brain-behavioural correlation between the respective desirability bias for the mild out-group and contrast estimates in the left supramarginal gyrus (bottom right-side). p < 0.001 at voxel-level and p < 0.01 at cluster-level.

