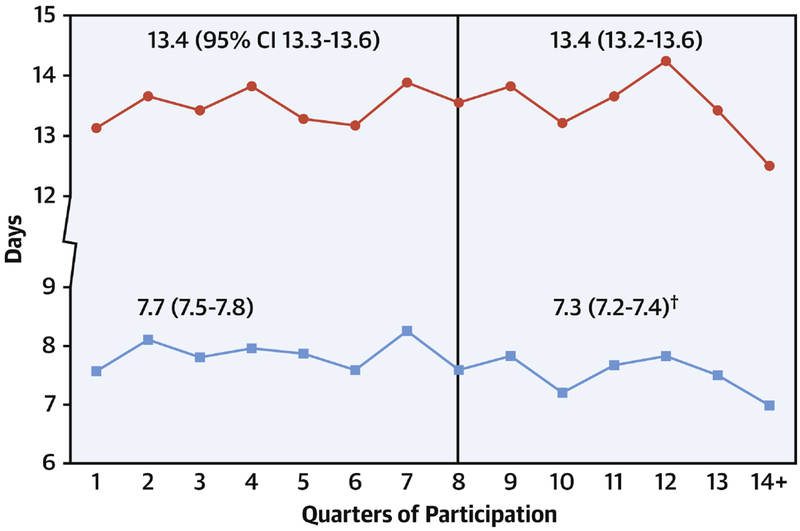
Figure 3. Change in postoperative length of stay over time.
Case mix adjusted mean postoperative length of stay by quarter. Vertical line represents end of baseline period. Red line represents hospital length of stay. Blue line represents cardiac ICU length of stay. The relative decrease in cardiac ICU length of stay in the post-exposure period was 5%.
† p<0.05 for comparison of baseline vs. post-exposure duration. CI, confidence interval.

