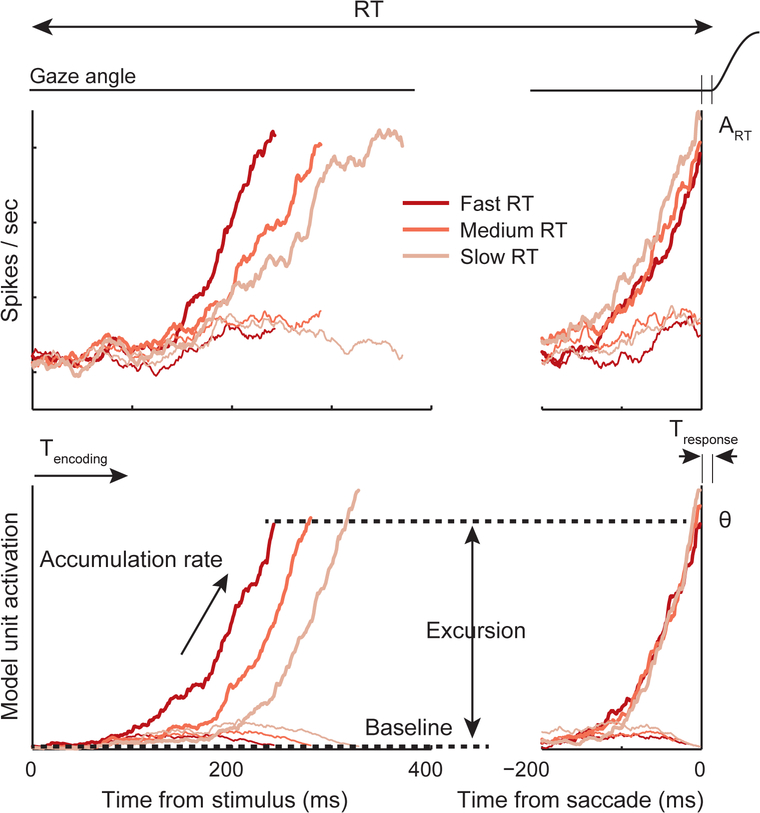
Box 2, Figure I.
Key parameters of stochastic accumulation process. RT of a gaze shift is portrayed. Top panels plot the evolving discharge rate of neurons recorded in a cortical area while monkeys were deciding where to shift gaze. The bottom panels plot the trajectory of stochastic accumulation in a model that was fit to the performance while the neurons were recorded. The left panels plot the values aligned on when the stimulus was presented. The right panels plot the values aligned on when the choice gaze shift was initiated. Progressively less saturated lines plot trajectories for progressively longer RT. The correspondence between observed neural modulation and modeled trajectories is interpreted as support for the model. Implicit in this interpretation is the proposition that the neurons are instantiating the process described by the model. The parameters are explained in the Box text.

