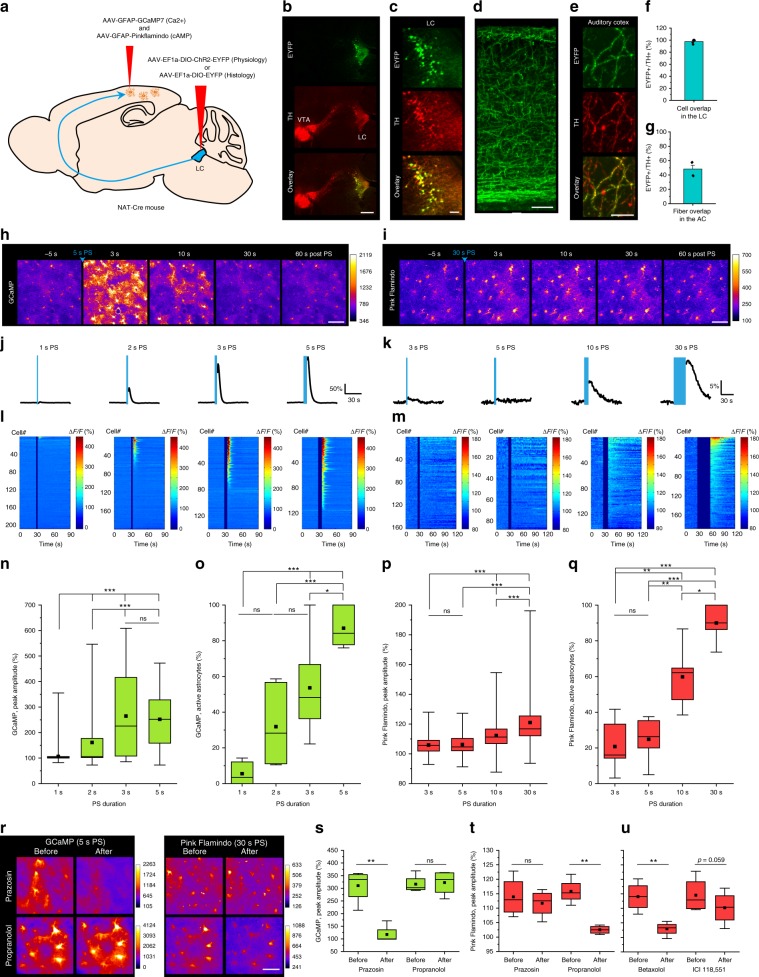
Fig. 1. Ca2+ and cAMP responses of cortical astrocytes to noradrenergic afferent activation.
a Illustration of virus injections. This image was adapted from Allen Mouse Brain Atlas. b EYFP in LC neurons 3 weeks after AAV delivery (green). LC is visualized by tyrosine hydroxylase (TH) immunohistochemistry (red). VTA: ventral tegmental area. c Magnified images of LC. d Innervation of LC NAergic neurons in the cerebral cortex. e EYFP-labeled LC-neuronal NAergic fibers overlap with TH+ fibers in the cortex. f Virtually all TH+ cells express EYFP in the LC (n = 5 images, 5 mice). g Unilateral AAV microinjection to the LC labels 50% of TH+ fibers in the cortex (n = 4 images, 3 mice). h, i Astrocytic Ca2+ and cAMP responses to optogenetically activated NAergic axons in the cortex with 5-s PS (h) and 30-s PS (i). j, k Average Ca2+ and cAMP responses of cortical astrocytes to varying NAergic fiber photostimulation (PS) length. l, m Individual cell responses are plotted and sorted by response amplitude. n, o Astrocytic Ca2+ activity analyzed by peak amplitude (n) (n = 208, 194, 139 cells, 144 cells) and active astrocytes (o) (n = 6–7 sessions, 5 mice). p, q Astrocytic cAMP activity analyzed by peak amplitude (p) (n = 161, 87, 142, 186 cells) and active astrocytes (q) (n = 5–6 sessions, 6 mice). r–u Pharmacological dissection of LC/NA axon-evoked astrocytic Ca2+ and cAMP. Representative images of GCaMP and Pink Flamindo with prazosin or propranolol application (r). Comparison of GCaMP (s) and Pink Flamindo (t) signals after prazosin or propranolol application. Pink Flamindo responses after betaxolol or ICI 118,551 application (u) (n = 4 mice for all plots). Analysis was performed from individual cells for n and p and from averages of individual sessions for the others. All astrocyte responses represent somatic signals hereinafter unless otherwise noted. Scale bars: b, 500 μm; c, d, h, i, 100 μm; r, 50 μm; e, 10 μm. Bar graphs: mean + SEM. Box plots: box range, 25–50–75% quatile; square, mean; whiskers, max–min. One-way ANOVA with Turkey’s test: n–q; paired t-test: s–u; *p < 0.05, **p < 0.01, ***p < 0.001.

