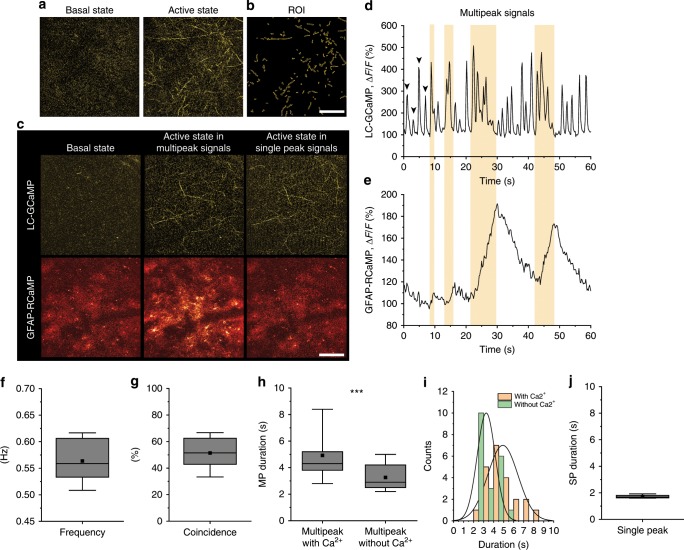
Fig. 4. Astrocytic Ca2+ signals are accompanied by NAergic multipeak signals in awake spontaneous states.
a, b Representative images of a basal state and an active state of NAergic fibers’ Ca2+ levels visualized by GCaMP6.f (a) and ROIs (b). Scale bar: 100 μm. c Representative pictures of LC-GCaMP and GFAP-RCaMP. Note that the GFAP-RCaMP images were acquired with a 5-s delay from the respective LC-GCaMP images. Only active states with MP signals accompany astrocytic Ca2+ elevation. Scale bar: 100 μm. d, e One minute simultaneous recording of LC-GCaMP and GFAP-RCaMP. NAergic signals are composed of SP signals (arrowhead) and MP signals (yellow period) (d). Astrocytic Ca2+ is correlated with NAergic MP signals (e). f Frequency of combined single and MP events. Individual MP signals were counted as single events (n = 1276 s recording, five mice for all analyses). g Coincidence of astrocytic Ca2+ with NAergic MP signals. h, i Durations of divided multipeak signals testing whether they accompany astrocytic Ca2+ are plotted in box plot (h) and histogram (i). j Durations of SP signals. Analysis was performed from individual SP or MP signals. Box plots: box range, 25–50–75% quatile; square, mean; whiskers, max–min. Student’s t-test with Welch’s correction: h; ***p < 0.001.

