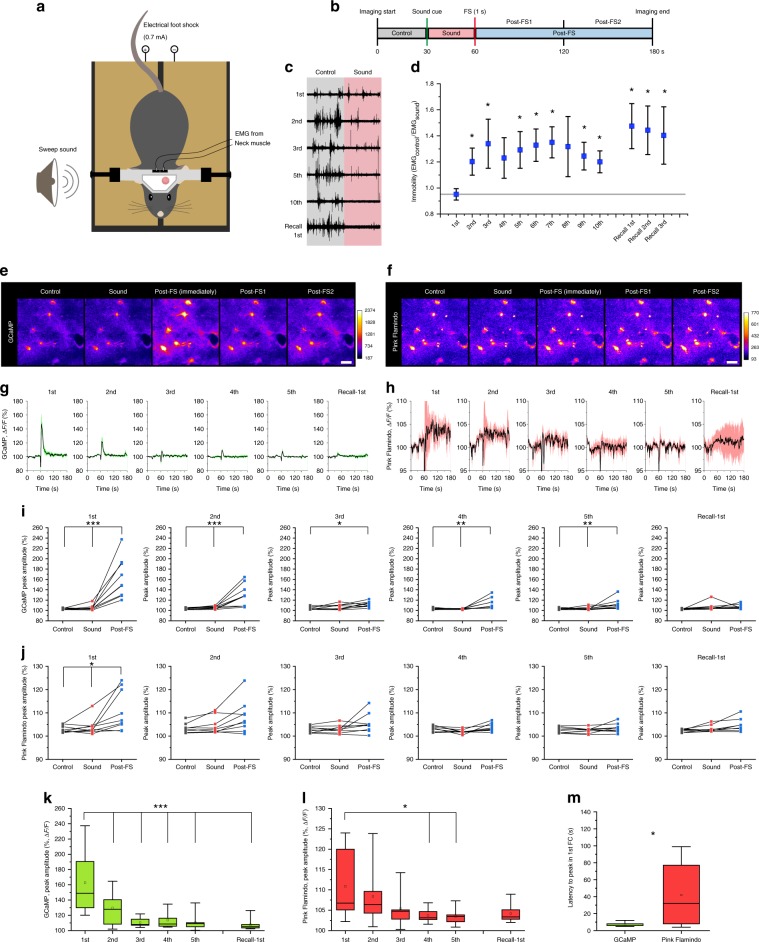
Fig. 6. High vigilance in head-fixed fear conditioning induces astrocytic Ca2+ and cAMP elevations.
a Illustration of head-fixed fear conditioning apparatus. b Protocol of head-fixed fear conditioning. c Representative EMG recording from neck muscles before and during sound cue. d Immobility index calculated by the ratio of EMG magnitudes before and during sound is plotted for each conditioning and recall session (n = 8 mice). e, f. Representative images of GCaMP (e) and Pink Flamindo (f) in astrocytes during the 1st conditioning. Images are averaged images of last 5 s from each phases except for post-FS (immediately). Post-FS (immediately) was averaged images of 3–7 s after PS (highest Ca2+). Scale bars: 20 μm. g, h Traces of mean ± SEM of GCaMP (g) and Pink Flamindo (h) in astrocytes for 1st–5th conditionings and 1st recall. i, j Peak amplitude of astrocyte GCaMP (i) (n = 9 mice for all analyses) and Pink Flamindo (j) in control, sound, and post-FS phase in 1–5th conditionings and 1st recall. k, l Comparison of peak amplitude in the post-FS phase of GCaMP (k) among 1–5th conditionings and 1st recall. m Latency to peak in the 1st conditioning shows a distinct difference between astrocytic Ca2+ and cAMP dynamics. Analysis was performed from the average of individual sessions. Box plots: box range, 25–50–75% quatile; square, mean; whiskers, max–min. Paired t-test (vs. 1st): d; one-way ANOVA with Turkey’s test: i–l; Student’s t-test with Welch’s correction: m; *p < 0.05, **p < 0.01, ***p < 0.001.

