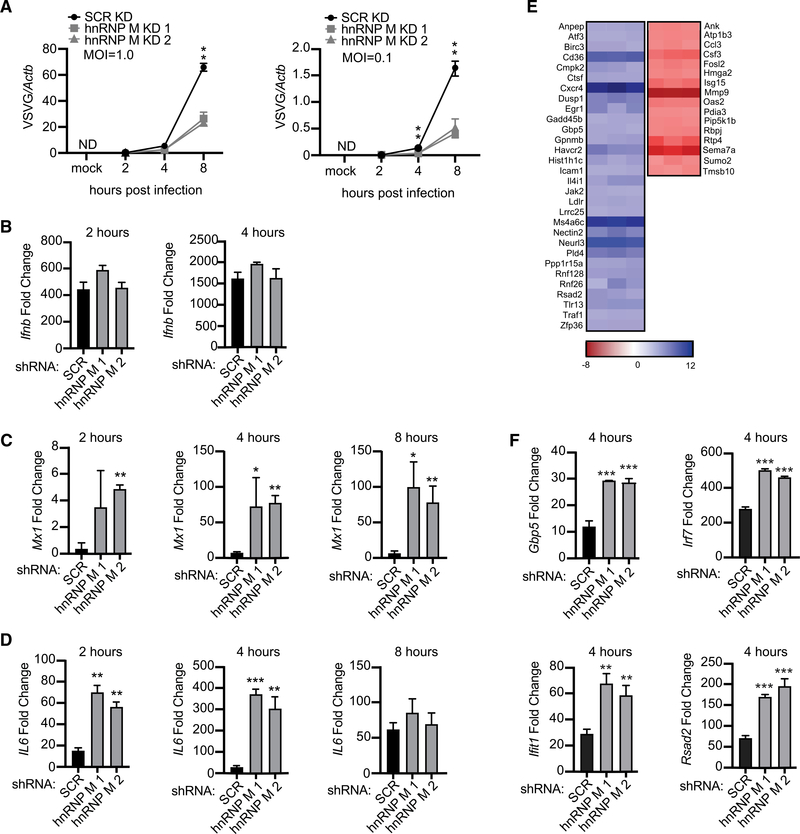
Figure 6. Knockdown of hnRNP M Enhances a Macrophage’s Ability to Control Viral Infection.
(A) Viral replication in hnRNP M KD and SCR control RAW 264.7 macrophages infected with VSV (MOI = 1.0, MOI = 0.1, or Mock) at 2, 4, and 8 h post-infection.
(B) qRT-PCR of Ifnb mRNA levels in SCR control and hnRNP M KD cells at 2 and 4 h post-infection, MOI = 1.
(C) qRT-PCR of Mx1 transcript in VSV-infected SCR control and hnRNP M KD cells at 2, 4, and 8 h post-infection, MOI = 1.
(D) qRT-PCR of IL6 transcript in SCR control and hnRNP M KD cells at 2, 4, and 8 h post-infection MOI = 1.
(E) Differential gene expression in hnRNP M KD cells compared to SCR control macrophages from earlier RNA-seq analysis (Figure 1) highlighting known viral response genes.
(F) qRT-PCR of Ifit, Irf7, Rsad2, and Gbp5 mRNA levels in SCR control and hnRNP M KD cells at 4 h post-infection, MOI = 1.
(A)-(E) are representative of 2 biological replicates with values indicating means ± SEM, n = 2. (F) is representative of 2 independent experiments that showed the same result with values representing means (SD), n = 3.

