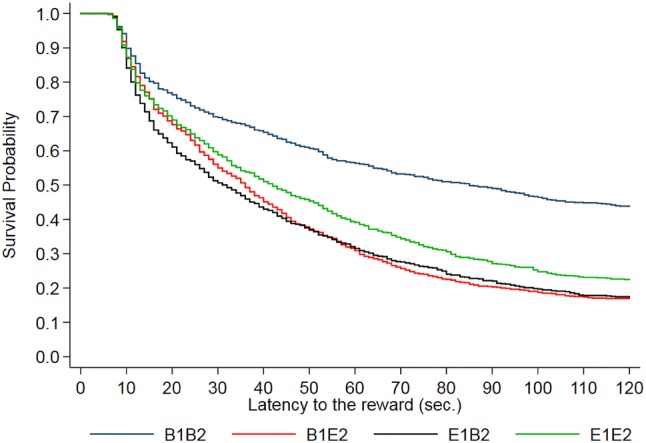
Fig. 2.

Kaplan-Meier curve showing the latency to reward for pigs from each housing group, with a maximum trial duration of 120 s. For each trial in which a pig got to the reward, the probability on the Y-axis drops. B1B2 and E1E2 refer to pigs housed in barren and enriched pens, respectively, throughout the experiment; B1E2 and E1B2 refer to pigs that experienced a change in environment from barren to enriched or vice versa from 7 weeks of age
