
Fig. 2.
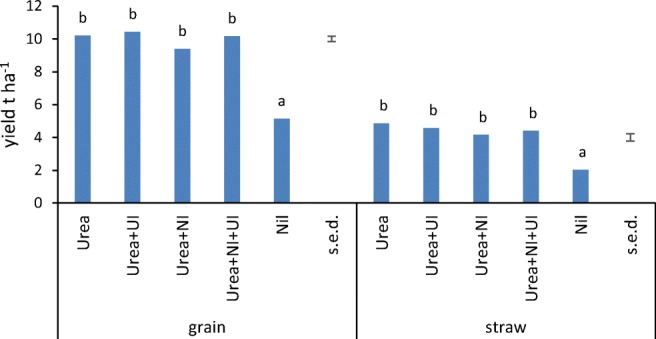
Wheat grain and straw yields at 85% dry matter expressed as t ha−1 (n = 4). Different letters above bars denote significantly different means (α = 0.05) according to Tukey’s post hoc test on ANOVA for each set of yields. ANOVA results: grain yield F4,12 = 95.0, P < .001; straw yield F4,12 = 29.7, P < .001