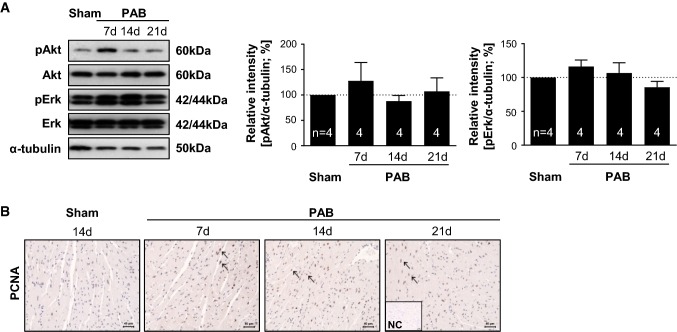
Fig. 2.
Hypertrophic signaling following PAB. a Left: representative Western blot analysis of Akt and Erk phosphorylation in right ventricles of C57/BL6 mice after sham or PAB for 7, 14 or 21 days (d). Right: densitometric analysis of Akt and Erk phosphorylation. Data were normalized to β-tubulin and sham was set to 100%. Data were analyzed by analysis of variance followed by Dunnett’s multiple-to-one comparison post hoc tests and are presented as mean ± standard error of mean (SEM). b Immunohistochemical staining of PCNA (in red) in C57/BL6 mice after sham or PAB. NC isotype control staining. Arrows indicate PCNA-positive nuclei

