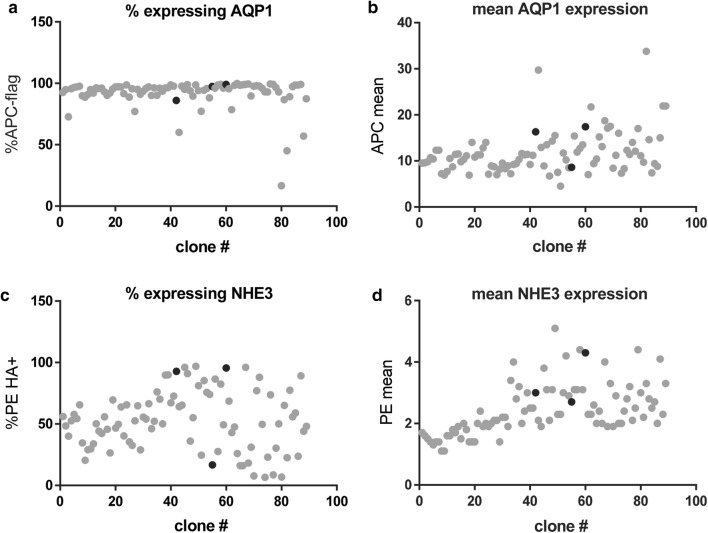
Figure 3.
Flow cytometry analysis of NHE3/AQP1 expressing clones. (a) evaluation of % of AQP1 expressing cells as well as mean fluorescent intensity for each clone. (b) evaluation of % of cumate-inducible NHE3 expressing cells as well as mean fluorescent intensity for each clone. Black dots indicate clones 42, 55, and 60 on the corresponding graphs.

