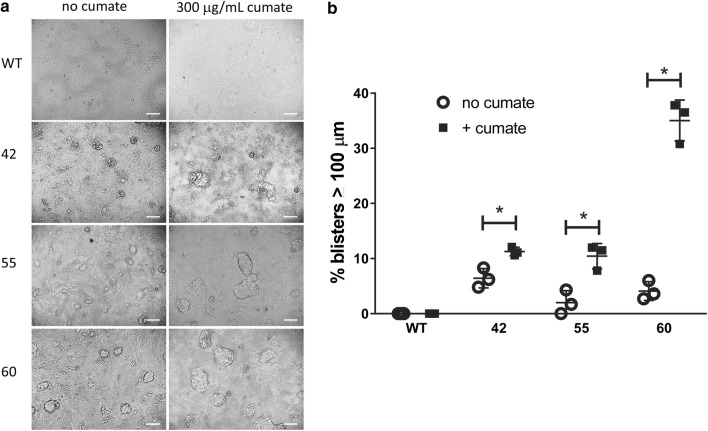
Figure 5.
NHE3/AQP1 overexpression enhance transport function in MDCK cells. (a) Phase contrast microscopy of WT and NHE3/AQP1 expressing clonal cell populations (clones 42, 55, and 60) in the absence or presence of cumate. The white bar in the lower right corner figure is a scale bar of 100 µm. (b) Quantitation of % blisters > 100 µM in the absence or presence of cumate (N = 3±SEM).

